Nesconset: Fire Incidents, New York (NY)
Where are fire incidents reported in Nesconset, NY
Something went wrong! Please refresh the page.
|
| |||||||||||||||||||||||||||||||||||||||||||||||||||||||||||||||||||||||||||||||||||||||||||||||||||||||||||||
2005 - 2018 National Fire Incident Reporting System (NFIRS) incidents
- Incident types reported to NFIRS in Nesconset, NY
- 1,84357.3%Rescue & EMS
- 39912.4%Fire
- 39812.4%False Alarm
- 3019.4%Hazardous Condition
- 2176.7%Good Intent Call
- 521.6%Service Call
- 70.2%Severe Weather
- Fire incident types reported to NFIRS in Nesconset, NY
- 22656.6%Structure Fires
- 13433.6%Outside Fires
- 205.0%Other
- 194.8%Mobile Property/Vehicle Fires
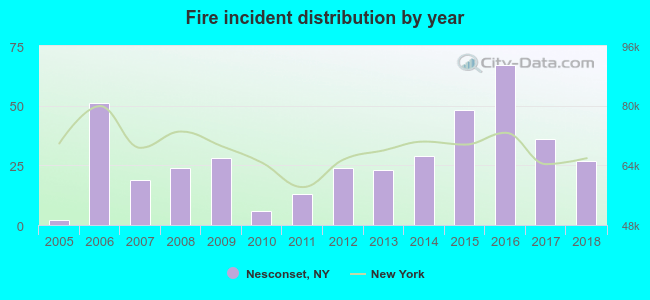 According to the data from the years 2005 - 2018 the average number of fire incidents per year is 28. The highest number of reported fire incidents - 67 took place in 2016, and the least - 2 in 2005. The data has a growing trend.
The average number of yearly fire incidents per 10k residents in Nesconset, NY compared to nearest cities:
(Note: Based on data for the last 3 years, including only cities with population 5,000 and above)
| Nesconset: | 32.4 |
| Lake Grove: | 10.4 |
| Lake Ronkonkoma: | 1.0 |
| Ronkonkoma: | 43.0 |
| Smithtown: | 18.5 |
| Hauppauge: | 30.2 |
| Centereach: | 9.9 |
| Stony Brook: | 12.1 |
| Central Islip: | 27.4 |
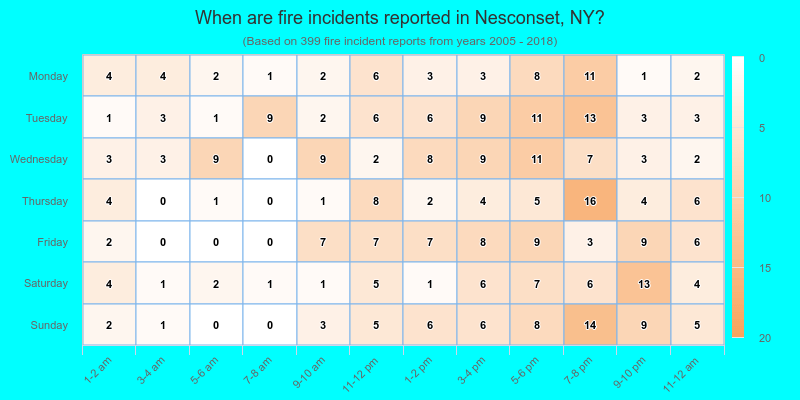
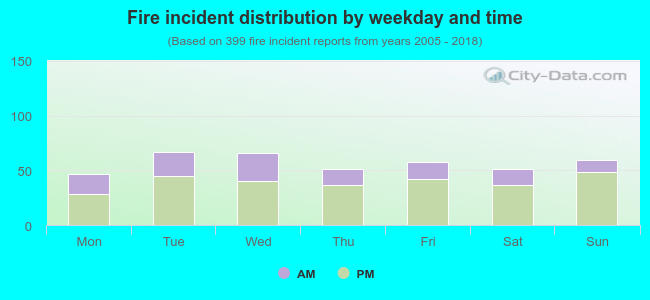 30.6% incidents where reported in the morning and 69.4% in the evening. The most fires (16.8%) took place on Tuesday, and the least (11.8%) on Monday.
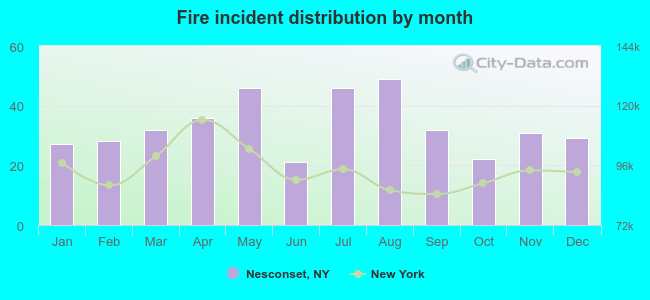 According to the 399 incident reports from years 2005 - 2018 most fires (12.3%) took place during August, and the least (5.3%) in June.
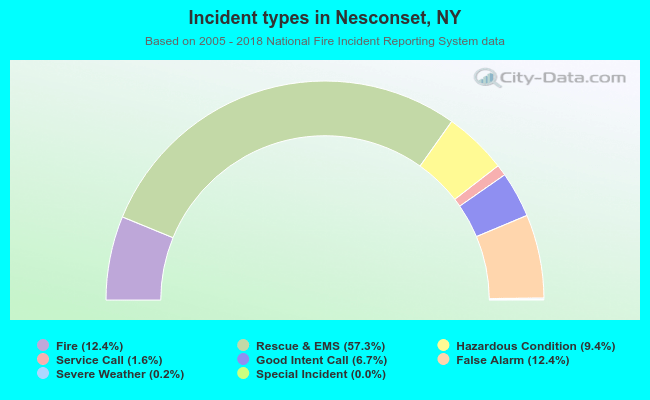 Out of all 3,218 cases reported during the years 2005 - 2018, the most belonged to the categories: Overpressure Rupture (57.3%), Fire (12.4%), and Good Intent Call (12.4%).
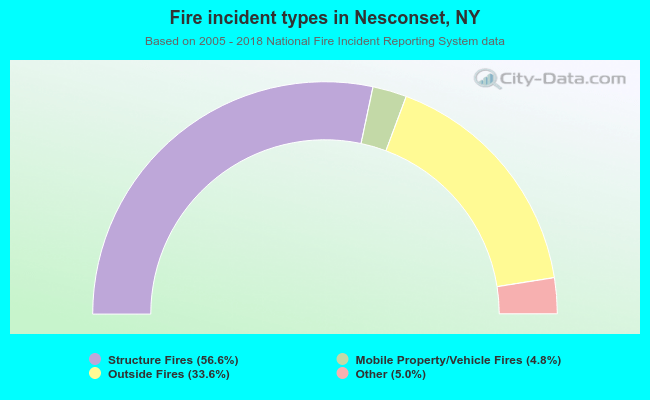 When looking into fire subcategories, the most reports belonged to: Structure Fires (56.6%), and Outside Fires (33.6%).