Hauppauge: Fire Incidents, New York (NY)
Where are fire incidents reported in Hauppauge, NY
Something went wrong! Please refresh the page.
| Fire incidents reported | |
|---|---|
| Sreet name | Count |
| VETERANS HIGHWAY | 158 |
| MOTOR PARKWAY | 118 |
| OSER AVENUE | 84 |
| DEVONSHIRE ROAD | 54 |
| LINCOLN BOULEVARD | 52 |
| WHEELER ROAD | 50 |
| ADAMS AVENUE | 40 |
| OLD WILLETS PATH | 38 |
| TERRY ROAD | 36 |
| RABRO DRIVE | 32 |
| WIRELESS BOULEVARD | 32 |
| COMMERCE DRIVE | 30 |
| TOWNLINE ROAD | 30 |
| EXPRESS DRIVE SOUTH | 28 |
| SCHNEIDER LANE | 26 |
| BLYDENBURGH ROAD | 24 |
| HOFFMAN LANE | 24 |
| MAC ARTHUR BOULEVARD | 24 |
| MARCUS BOULEVARD | 24 |
| EXPRESS DRIVE NORTH | 20 |
| EXPRESSWAY DRIVE SOUTH | 20 |
| EAGLE LANE | 18 |
| GILPIN AVENUE | 18 |
| KENNEDY DRIVE | 18 |
| NEW HIGHWAY | 18 |
| NORTHFIELD ROAD | 18 |
| ROUTE 347 | 18 |
| VETERANS MEMORIAL HIGHWAY | 18 |
| GRISSOM WAY | 16 |
| RIDGEFIELD ROAD | 16 |
2002 - 2018 National Fire Incident Reporting System (NFIRS) incidents
- Incident types reported to NFIRS in Hauppauge, NY
- 1,95727.9%Rescue & EMS
- 1,93627.6%False Alarm
- 1,24717.8%Hazardous Condition
- 1,08315.5%Fire
- 4566.5%Good Intent Call
- 2974.2%Service Call
- 140.2%Severe Weather
- 80.1%Special Incident
- Fire incident types reported to NFIRS in Hauppauge, NY
- 50846.9%Structure Fires
- 32029.5%Outside Fires
- 23321.5%Mobile Property/Vehicle Fires
- 222.0%Other
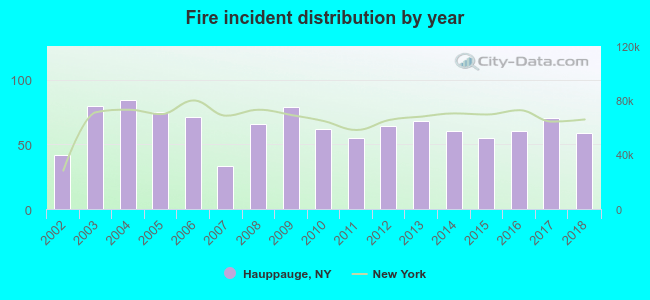 Based on the data from the years 2002 - 2018 the average number of fire incidents per year is 64. The highest number of fire incidents - 84 took place in 2004, and the least - 33 in 2007. The data has a rising trend.
The average number of yearly fire incidents per 10k residents in Hauppauge, NY compared to nearest cities:
(Note: Based on data for the last 3 years, including only cities with population 5,000 and above)
| Hauppauge: | 30.2 |
| Central Islip: | 27.4 |
| Smithtown: | 18.5 |
| Brentwood: | 21.8 |
| Nesconset: | 32.4 |
| Ronkonkoma: | 43.0 |
| Commack: | 5.4 |
| Islip Terrace: | 14.2 |
| Lake Ronkonkoma: | 1.0 |
 The median response time based on all reported fire incidents is 4 minutes. This is close to the New York median value.
The median response time in Hauppauge, NY compared to nearest cities:
(Note: Based on data for all years, including only cities with at least 500 fire incidents)
| Hauppauge: | 4 minutes |
| Central Islip: | 5 minutes |
| Smithtown: | 6 minutes |
| Brentwood: | 6 minutes |
| Ronkonkoma: | 6 minutes |
| Commack: | 5 minutes |
| Bohemia: | 4 minutes |
| Bay Shore: | 4 minutes |
| Holbrook: | 4 minutes |
 According to the reports from the years 2002 - 2018 the average number of fire-related casualties per year is 2. The highest number of injuries - 6 took place in 2005, and the lowest - 0 in 2003. The data has a constant trend.
The average number of injuries per 1,000 fires is 29. This indicator was the highest - 80 in 2005, and the lowest 0 in 2003. The trend for casualties per 1,000 fires is declining. Compared to the state value the number of injuries per 1,000 incidents is much higher.
According to the reports from the years 2002 - 2018 the average number of fire-related casualties per year is 2. The highest number of injuries - 6 took place in 2005, and the lowest - 0 in 2003. The data has a constant trend.
The average number of injuries per 1,000 fires is 29. This indicator was the highest - 80 in 2005, and the lowest 0 in 2003. The trend for casualties per 1,000 fires is declining. Compared to the state value the number of injuries per 1,000 incidents is much higher.Casualties per 1,000 incidents in Hauppauge, NY compared to nearest cities:
(Note: Based on data for all years, including only cities with at least 500 fire incidents)
| Hauppauge: | 28.6 |
| Central Islip: | 0.0 |
| Smithtown: | 4.5 |
| Brentwood: | 6.7 |
| Ronkonkoma: | 7.7 |
| Commack: | 1.6 |
| Bohemia: | 0.0 |
| Bay Shore: | 7.8 |
| Holbrook: | 9.9 |
 34.7% incidents where reported in the morning and 65.3% in the evening. The most fires (15.8%) took place on Wednesday, and the least (11.4%) on Saturday.
 According to the 1,083 reports from years 2002 - 2018 most fires (11.0%) took place during April, and the least (6.6%) in August.
 Out of all 7,003 cases reported during the years 2002 - 2018, the most belonged to the categories: Rescue & EMS (27.9%), False Alarm (27.6%), and Hazardous Condition (17.8%).
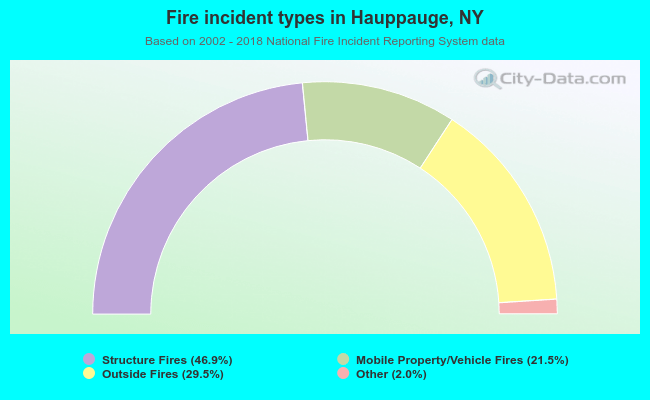 When looking into fire subcategories, the most reports belonged to: Structure Fires (46.9%), and Outside Fires (29.5%).