Stony Brook: Fire Incidents, New York (NY)
Where are fire incidents reported in Stony Brook, NY
Something went wrong! Please refresh the page.
|
| |||||||||||||||||||||||||||||||||||||||||||||||||||||||||||||||||||||||||||||||||||||||||||||||||||||||||||||
2003 - 2018 National Fire Incident Reporting System (NFIRS) incidents
- Incident types reported to NFIRS in Stony Brook, NY
- 2,76953.0%Rescue & EMS
- 1,14421.9%False Alarm
- 5079.7%Good Intent Call
- 4358.3%Hazardous Condition
- 2294.4%Fire
- 1322.5%Service Call
- Fire incident types reported to NFIRS in Stony Brook, NY
- 12655.0%Structure Fires
- 7532.8%Outside Fires
- 219.2%Mobile Property/Vehicle Fires
- 73.1%Other
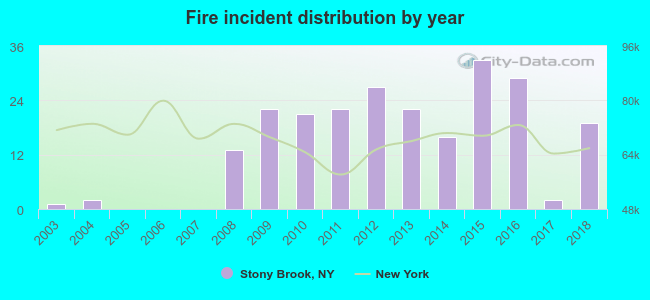 Based on the data from the years 2003 - 2018 the average number of fire incidents per year is 14. The highest number of fires - 33 took place in 2015, and the least - 0 in 2005. The data has a rising trend.
The average number of yearly fire incidents per 10k residents in Stony Brook, NY compared to nearest cities:
(Note: Based on data for the last 3 years, including only cities with population 5,000 and above)
| Stony Brook: | 12.1 |
| Centereach: | 9.9 |
| Lake Grove: | 10.4 |
| Terryville: | 1.7 |
| Nesconset: | 32.4 |
| Port Jefferson: | 22.5 |
| Selden: | 31.9 |
| Lake Ronkonkoma: | 1.0 |
| Smithtown: | 18.5 |
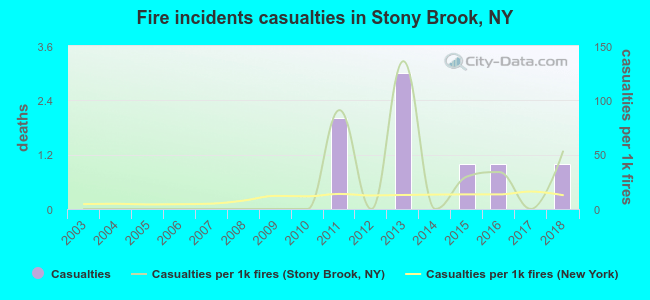 Based on the reports from the years 2003 - 2018 the average number of fire-related yearly casualties is 1. The highest number of casualties - 3 took place in 2013, and the lowest - 0 in 2003. The data has a rising trend.
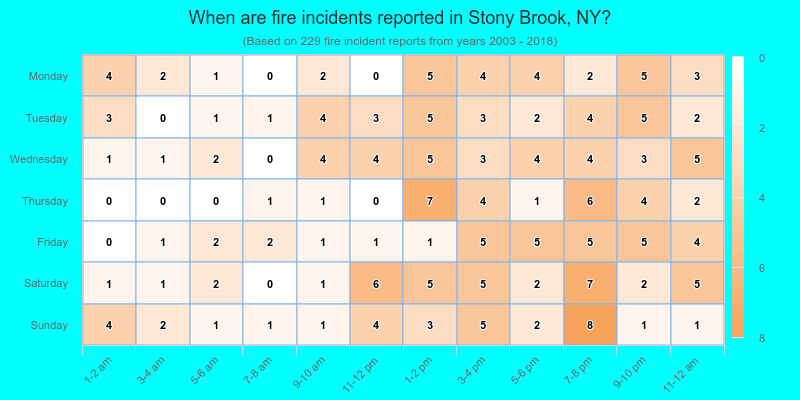
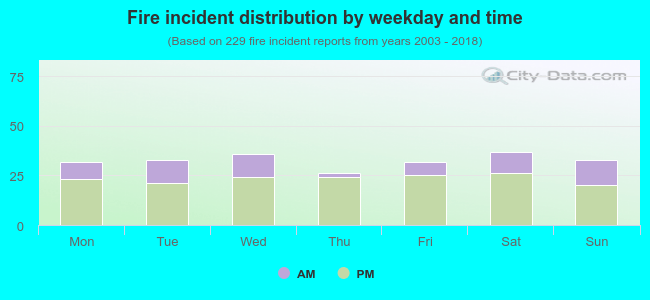 28.8% incidents where reported in the morning and 71.2% in the evening. The most fires (16.2%) took place on Saturday, and the least (11.4%) on Thursday.
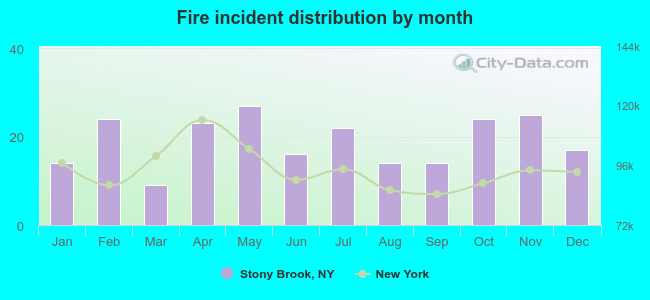 According to the 229 fire incidents from years 2003 - 2018 most fires (11.8%) took place during May, and the least (3.9%) in March.
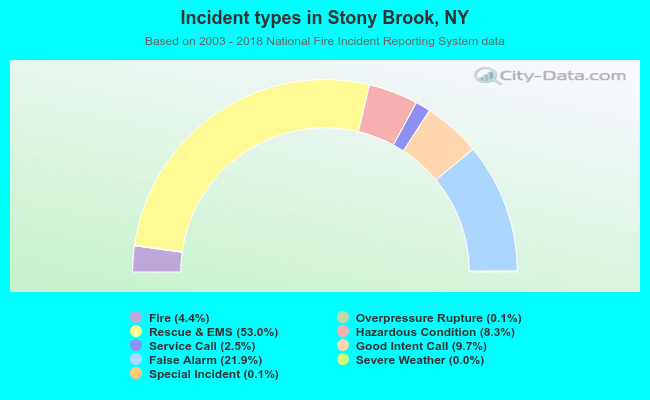 Out of all 5,228 cases reported during the years 2003 - 2018, the most belonged to the categories: Rescue & EMS (53.0%), False Alarm (21.9%), and Good Intent Call (9.7%).
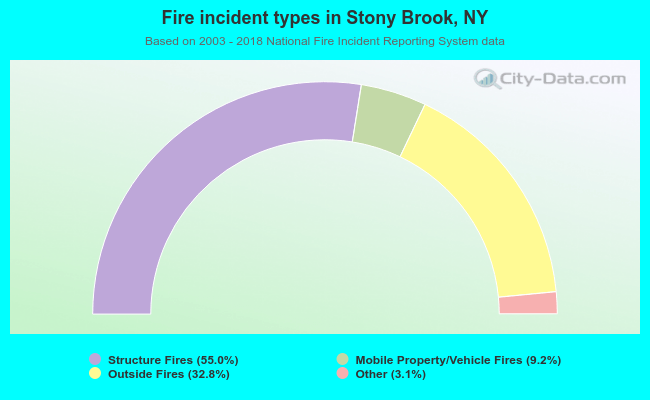 When looking into fire subcategories, the most reports belonged to: Structure Fires (55.0%), and Outside Fires (32.8%).