North Bend: Fire Incidents, Washington (WA)
Where are fire incidents reported in North Bend, WA
Something went wrong! Please refresh the page.
|
| |||||||||||||||||||||||||||||||||||||||||||||||||||||||||||||||||||||||||||||||||||||||||||||||||||||||||||||
2002 - 2018 National Fire Incident Reporting System (NFIRS) incidents
- Incident types reported to NFIRS in North Bend, WA
- 6,11069.5%Rescue & EMS
- 1,07112.2%Good Intent Call
- 6527.4%Fire
- 3694.2%Service Call
- 3514.0%False Alarm
- 2092.4%Hazardous Condition
- 210.2%Special Incident
- Fire incident types reported to NFIRS in North Bend, WA
- 33851.8%Structure Fires
- 15924.4%Outside Fires
- 12218.7%Mobile Property/Vehicle Fires
- 335.1%Other
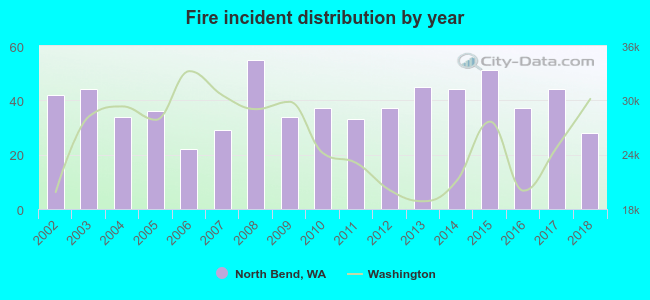 Based on the data from the years 2002 - 2018 the average number of fires per year is 38. The highest number of fire incidents - 55 took place in 2008, and the least - 22 in 2006. The data has a decreasing trend.
The average number of yearly fire incidents per 10k residents in North Bend, WA compared to nearest cities:
(Note: Based on data for the last 3 years, including only cities with population 5,000 and above)
| North Bend: | 55.2 |
| Snoqualmie: | 10.0 |
| Issaquah: | 26.1 |
| Sammamish: | 11.3 |
| Maple Valley: | 7.2 |
| Covington: | 17.4 |
| Newcastle: | 17.9 |
| Duvall: | 28.4 |
| Bellevue: | 26.4 |
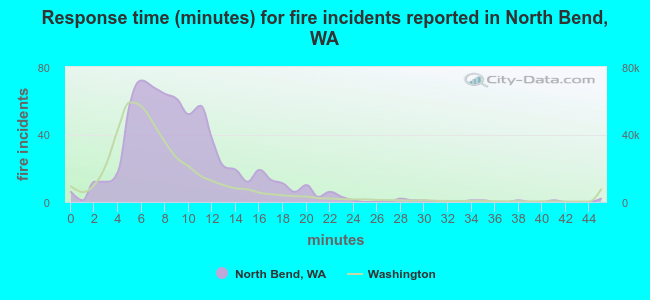 The median response time based on all reported fire incidents is 9 minutes. This is higher compared to the state median value.
The median response time in North Bend, WA compared to nearest cities:
(Note: Based on data for all years, including only cities with at least 500 fire incidents)
| North Bend: | 9 minutes |
| Issaquah: | 7 minutes |
| Sammamish: | 7 minutes |
| Maple Valley: | 6 minutes |
| Covington: | 6 minutes |
| Bellevue: | 6 minutes |
| Renton: | 6 minutes |
| Redmond: | 6 minutes |
| Mercer Island: | 6 minutes |
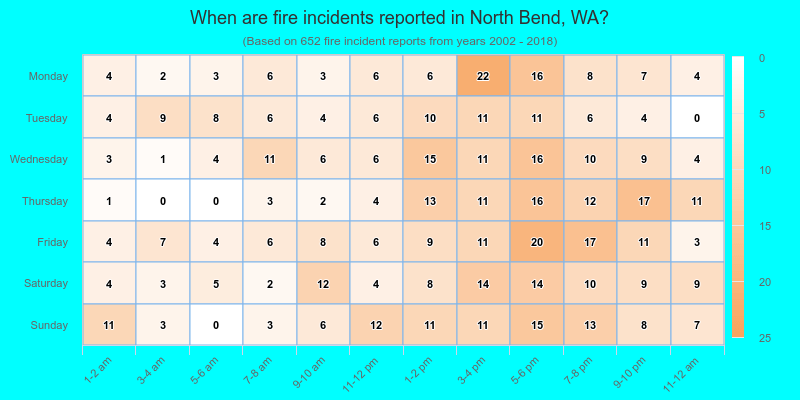
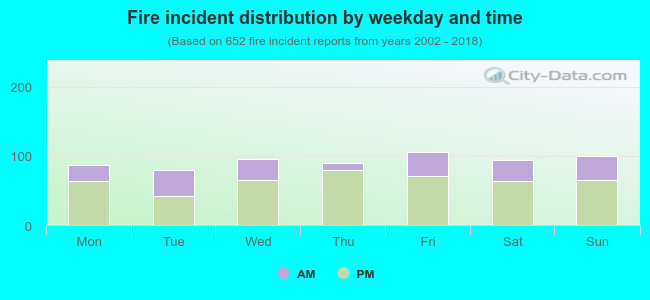 31.0% incidents where reported in the morning and 69.0% in the evening. The most fires (16.3%) took place on Friday, and the least (12.1%) on Tuesday.
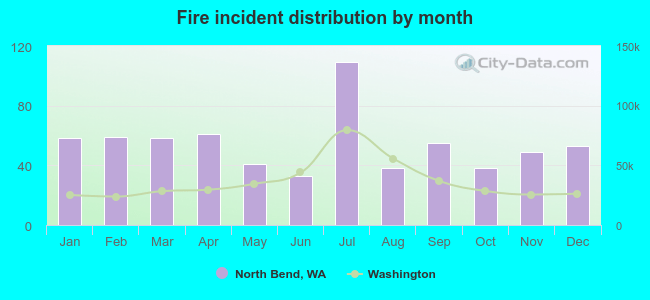 According to the 652 fire incident reports from years 2002 - 2018 most fires (16.7%) took place during July, and the least (5.1%) in June.
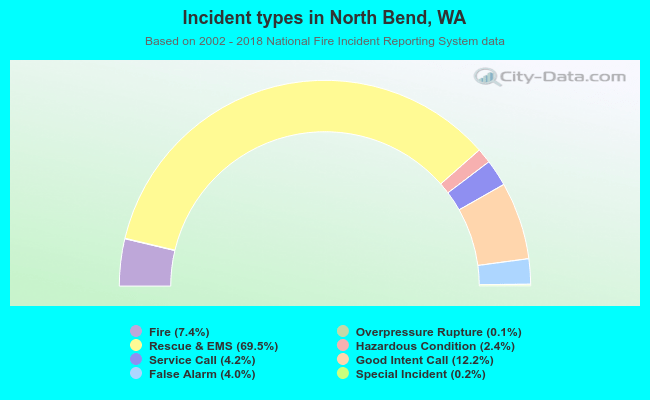 Out of all 8,788 cases reported during the years 2002 - 2018, the most belonged to the categories: Rescue & EMS (69.5%), Good Intent Call (12.2%), and Fire (7.4%).
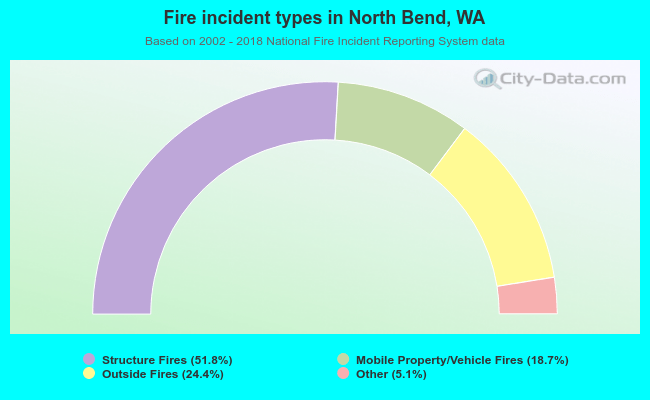 When looking into fire subcategories, the most incidents belonged to: Structure Fires (51.8%), and Outside Fires (24.4%).