North Logan: Fire Incidents, Utah (UT)
Where are fire incidents reported in North Logan, UT
Something went wrong! Please refresh the page.
|
| |||||||||||||||||||||||||||||||||||||||||||||||||||||||||||||||||||||||||||||||||||||||||||||||||||||||||||||
2002 - 2018 National Fire Incident Reporting System (NFIRS) incidents
- Incident types reported to NFIRS in North Logan, UT
- 3,08772.1%Rescue & EMS
- 3498.2%Hazardous Condition
- 2786.5%False Alarm
- 2596.1%Fire
- 2425.7%Good Intent Call
- 601.4%Service Call
- Fire incident types reported to NFIRS in North Logan, UT
- 10942.1%Outside Fires
- 9135.1%Structure Fires
- 3714.3%Mobile Property/Vehicle Fires
- 228.5%Other
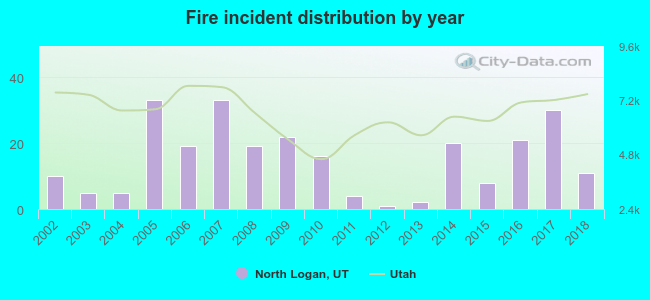 According to the data from the years 2002 - 2018 the average number of fires per year is 15. The highest number of fire incidents - 33 took place in 2005, and the least - 1 in 2012. The data has a rising trend.
The average number of yearly fire incidents per 10k residents in North Logan, UT compared to nearest cities:
(Note: Based on data for the last 3 years, including only cities with population 5,000 and above)
| North Logan: | 20.9 |
| Logan: | 17.6 |
| Smithfield: | 17.3 |
| Providence: | 14.6 |
| Nibley: | 16.2 |
| Hyrum: | 19.2 |
| Tremonton: | 32.6 |
| Brigham City: | 24.9 |
| Pleasant View: | 26.4 |
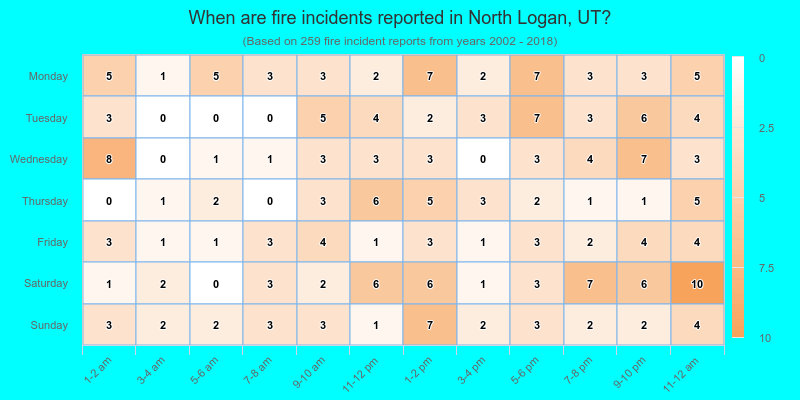
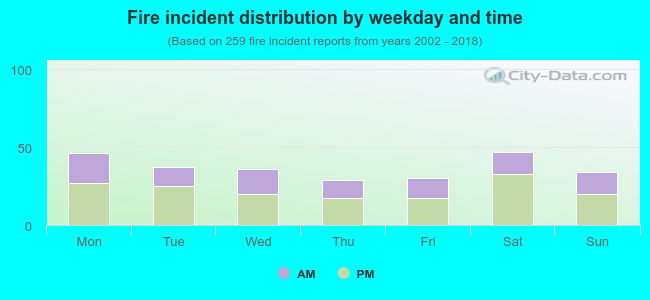 38.6% incidents where reported in the morning and 61.4% in the evening. The most fires (18.1%) took place on Saturday, and the least (11.2%) on Thursday.
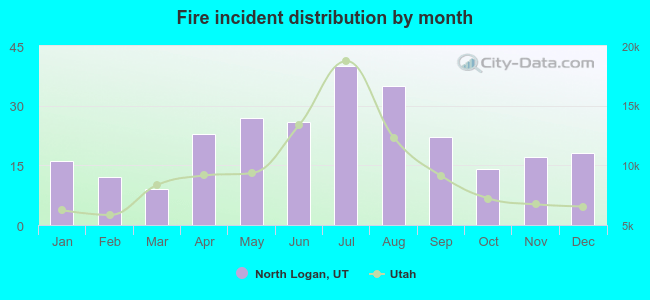 According to the 259 fires from years 2002 - 2018 most fires (15.4%) took place during July, and the least (3.5%) in March.
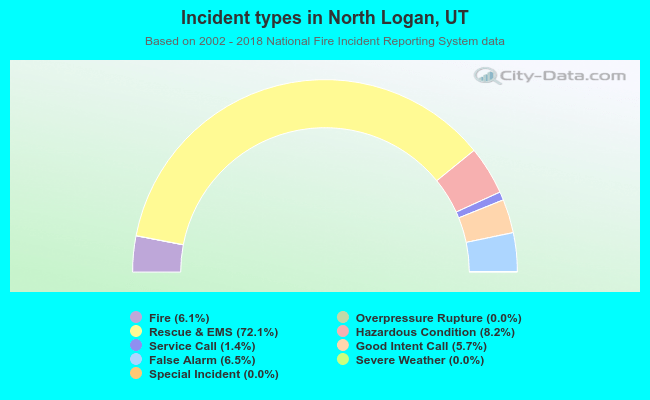 Out of all 4,279 cases reported during the years 2002 - 2018, the most belonged to the categories: Rescue & EMS (72.1%), Hazardous Condition (8.2%), and False Alarm (6.5%).
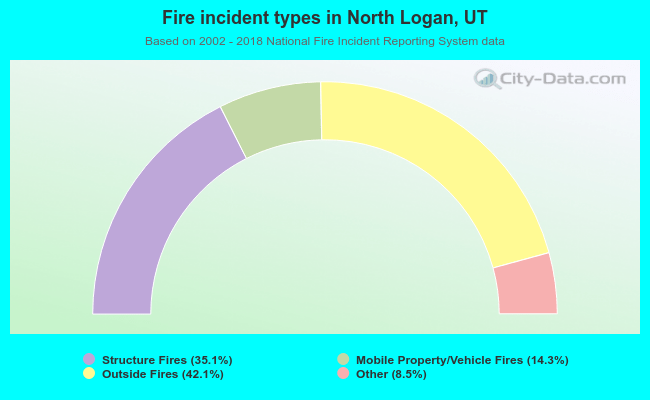 When looking into fire subcategories, the most reports belonged to: Outside Fires (42.1%), and Structure Fires (35.1%).