Tremonton: Fire Incidents, Utah (UT)
Where are fire incidents reported in Tremonton, UT
Something went wrong! Please refresh the page.
|
| |||||||||||||||||||||||||||||||||||||||||||||||||||||||||||||||||||||||||||||||||||||||||||||||||||||||||||||
2002 - 2018 National Fire Incident Reporting System (NFIRS) incidents
- Incident types reported to NFIRS in Tremonton, UT
- 85850.5%Rescue & EMS
- 49729.2%Fire
- 18811.1%Hazardous Condition
- 985.8%False Alarm
- 412.4%Good Intent Call
- 160.9%Service Call
- 20.1%Overpressure Rupture
- Fire incident types reported to NFIRS in Tremonton, UT
- 24148.5%Outside Fires
- 15731.6%Structure Fires
- 9619.3%Mobile Property/Vehicle Fires
- 30.6%Other
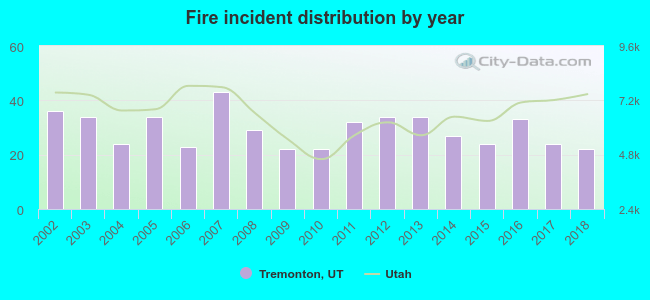 According to the data from the years 2002 - 2018 the average number of fire incidents per year is 29. The highest number of reported fire incidents - 43 took place in 2007, and the least - 22 in 2009. The data has a declining trend.
The average number of yearly fire incidents per 10k residents in Tremonton, UT compared to nearest cities:
(Note: Based on data for the last 3 years, including only cities with population 5,000 and above)
| Tremonton: | 32.6 |
| Brigham City: | 24.9 |
| Nibley: | 16.2 |
| Hyrum: | 19.2 |
| Logan: | 17.6 |
| Providence: | 14.6 |
| North Logan: | 20.9 |
| Smithfield: | 17.3 |
| Pleasant View: | 26.4 |
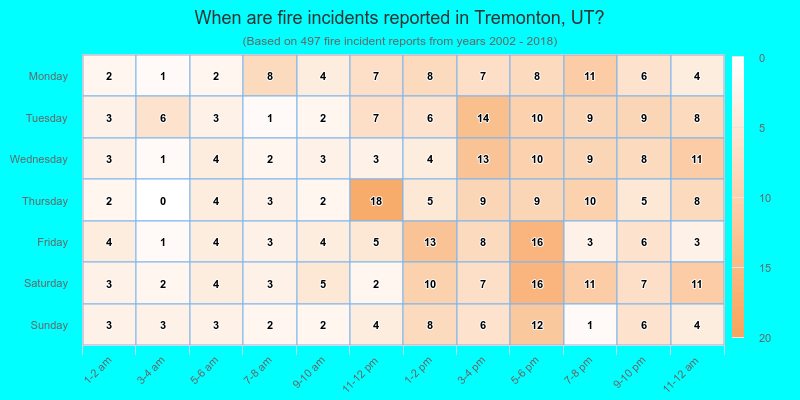
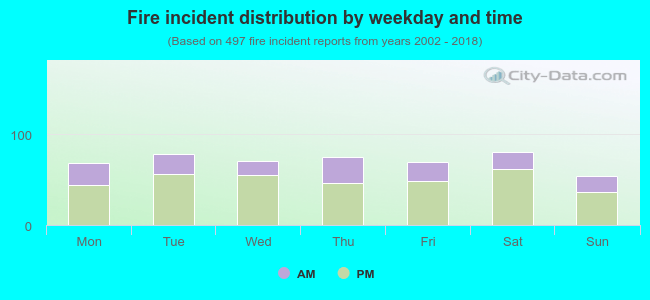 29.8% incidents where reported in the morning and 70.2% in the evening. The most fires (16.3%) took place on Saturday, and the least (10.9%) on Sunday.
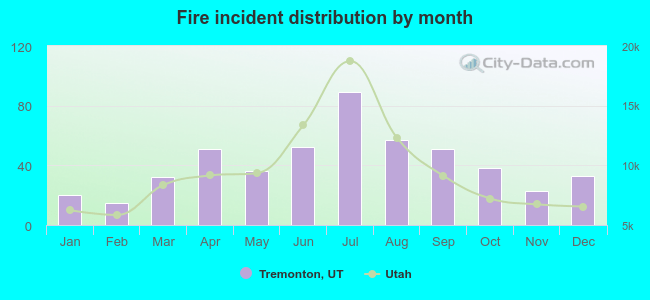 According to the 497 fire incidents from years 2002 - 2018 most fires (17.9%) took place during July, and the least (3.0%) in February.
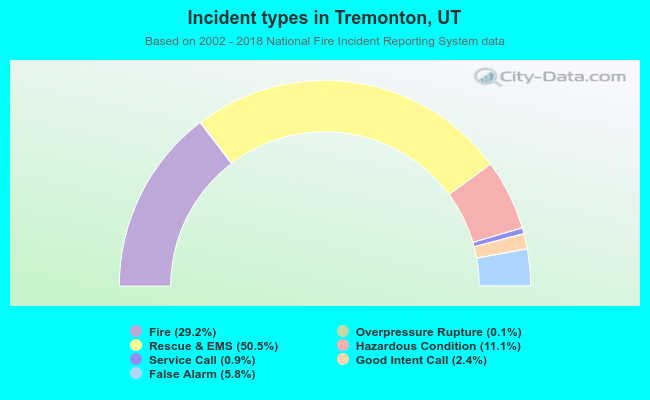 Out of all 1,700 cases reported during the years 2002 - 2018, the most belonged to the categories: Rescue & EMS (50.5%), Fire (29.2%), and Hazardous Condition (11.1%).
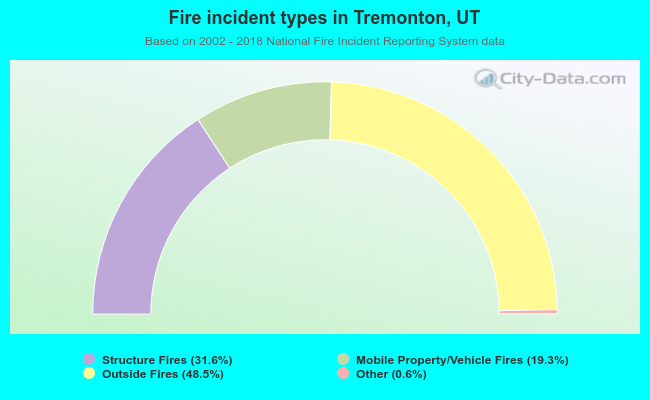 When looking into fire subcategories, the most reports belonged to: Outside Fires (48.5%), and Structure Fires (31.6%).