North Manchester: Fire Incidents, Indiana (IN)
Where are fire incidents reported in North Manchester, IN
Something went wrong! Please refresh the page.
|
| |||||||||||||||||||||||||||||||||||||||||||||||||||||||||||||||||||||||||||||||||||||||||||||||||||||||||||||
2002 - 2018 National Fire Incident Reporting System (NFIRS) incidents
- Incident types reported to NFIRS in North Manchester, IN
- 1,09251.3%Rescue & EMS
- 51224.1%Fire
- 22310.5%Hazardous Condition
- 1416.6%False Alarm
- 914.3%Good Intent Call
- 582.7%Service Call
- 60.3%Overpressure Rupture
- 40.2%Special Incident
- Fire incident types reported to NFIRS in North Manchester, IN
- 25449.6%Structure Fires
- 17434.0%Outside Fires
- 438.4%Mobile Property/Vehicle Fires
- 418.0%Other
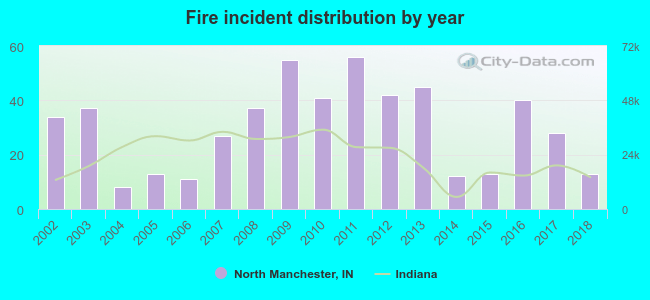 According to the data from the years 2002 - 2018 the average number of fire incidents per year is 30. The highest number of reported fire incidents - 56 took place in 2011, and the least - 8 in 2004. The data has a declining trend.
The average number of yearly fire incidents per 10k residents in North Manchester, IN compared to nearest cities:
(Note: Based on data for the last 3 years, including only cities with population 5,000 and above)
| North Manchester: | 45.1 |
| Wabash: | 40.9 |
| Huntington: | 30.9 |
| Warsaw: | 55.3 |
| Columbia City: | 56.6 |
| Peru: | 4.5 |
| Rochester: | 82.8 |
| Marion: | 53.6 |
| Nappanee: | 37.2 |
 The median response time based on all reported fire incidents is 6 minutes. This is comparable to the state median value.
The median response time in North Manchester, IN compared to nearest cities:
(Note: Based on data for all years, including only cities with at least 500 fire incidents)
| North Manchester: | 6 minutes |
| Pierceton: | 7 minutes |
| Wabash: | 5 minutes |
| Huntington: | 4 minutes |
| Warsaw: | 5 minutes |
| Columbia City: | 7 minutes |
| Peru: | 5 minutes |
| Rochester: | 8 minutes |
| Syracuse: | 7 minutes |
 29.1% incidents where reported in the morning and 70.9% in the evening. The most fires (16.6%) took place on Saturday, and the least (11.3%) on Wednesday.
 According to the 512 fires from years 2002 - 2018 most fires (13.3%) took place during March, and the least (6.3%) in December.
 Out of all 2,127 cases reported during the years 2002 - 2018, the most belonged to the categories: Rescue & EMS (51.3%), Fire (24.1%), and Hazardous Condition (10.5%).
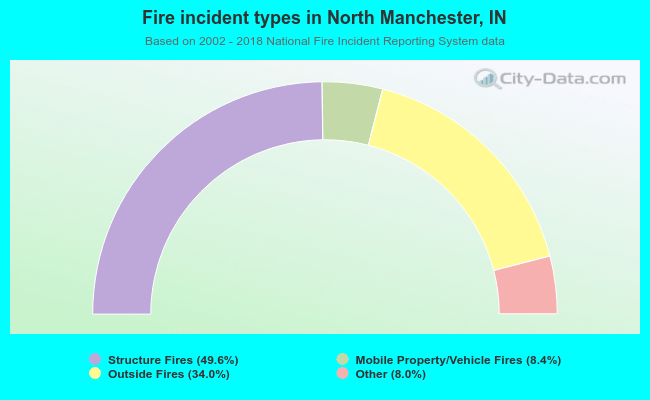 When looking into fire subcategories, the most reports belonged to: Structure Fires (49.6%), and Outside Fires (34.0%).