Huntington: Fire Incidents, Indiana (IN)
Where are fire incidents reported in Huntington, IN
Something went wrong! Please refresh the page.
| Fire incidents reported | |
|---|---|
| Sreet name | Count |
| JEFFERSON ST | 124 |
| MARKET ST | 78 |
| PARK DR | 78 |
| RIVERFORK DR | 60 |
| STATE ST | 58 |
| FRANKLIN ST | 52 |
| ETNA AVE | 44 |
| 100 | 40 |
| 200 N RD | 40 |
| 800 | 38 |
| BROADWAY ST | 38 |
| WASHINGTON ST | 38 |
| GUILFORD ST | 36 |
| TIPTON ST | 36 |
| 500 N RD | 34 |
| 900 RD | 34 |
| RIVERSIDE DR | 34 |
| HENRY ST | 32 |
| 300 RD | 30 |
| 700 | 30 |
| 750 | 30 |
| 300 | 28 |
| BRIANT ST | 28 |
| FIRST ST | 28 |
| 400 | 26 |
| CONDIT ST | 26 |
| EVERGREEN RD | 26 |
| HAUENSTEIN RD | 26 |
| HITZFIELD ST | 26 |
| COURT ST | 24 |
| Other | 358 |
2002 - 2018 National Fire Incident Reporting System (NFIRS) incidents
- Incident types reported to NFIRS in Huntington, IN
- 3,27644.2%Rescue & EMS
- 1,58021.3%Fire
- 1,13115.2%Hazardous Condition
- 5547.5%False Alarm
- 3855.2%Service Call
- 3765.1%Good Intent Call
- 801.1%Special Incident
- 220.3%Overpressure Rupture
- 130.2%Severe Weather
- Fire incident types reported to NFIRS in Huntington, IN
- 64540.8%Structure Fires
- 64440.8%Outside Fires
- 23815.1%Mobile Property/Vehicle Fires
- 533.4%Other
 Based on the data from the years 2002 - 2018 the average number of fires per year is 93. The highest number of fire incidents - 138 took place in 2006, and the least - 14 in 2018. The data has a decreasing trend.
The average number of yearly fire incidents per 10k residents in Huntington, IN compared to nearest cities:
(Note: Based on data for the last 3 years, including only cities with population 5,000 and above)
| Huntington: | 30.9 |
| North Manchester: | 45.1 |
| Wabash: | 40.9 |
| Columbia City: | 56.6 |
| Bluffton: | 4.3 |
| Fort Wayne: | 23.1 |
| Marion: | 53.6 |
| Gas City: | 58.0 |
| New Haven: | 20.8 |
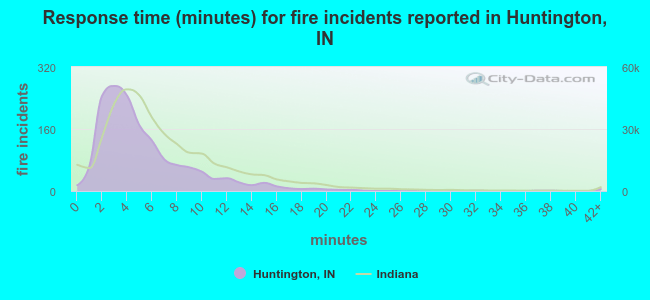 The median response time based on all reported fire incidents is 4 minutes. This is lower than the state median value.
The median response time in Huntington, IN compared to nearest cities:
(Note: Based on data for all years, including only cities with at least 500 fire incidents)
| Huntington: | 4 minutes |
| North Manchester: | 6 minutes |
| Wabash: | 5 minutes |
| Columbia City: | 7 minutes |
| Bluffton: | 6 minutes |
| Fort Wayne: | 5 minutes |
| Pierceton: | 7 minutes |
| Marion: | 4 minutes |
| New Haven: | 5 minutes |
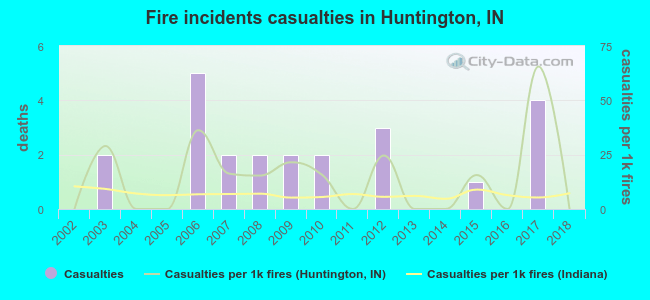 According to the data from the years 2002 - 2018 the average number of fire-related casualties per year is 1. The highest number of reported injuries - 5 took place in 2006, and the lowest - 0 in 2002. The data has a constant trend.
The average number of casualties per 1,000 fires is 14. This indicator was the highest - 66 in 2017, and the lowest 0 in 2002. The trend for casualties per 1,000 fire incidents is constant. Compared to the state value the number of injuries per 1,000 fires is much higher.
According to the data from the years 2002 - 2018 the average number of fire-related casualties per year is 1. The highest number of reported injuries - 5 took place in 2006, and the lowest - 0 in 2002. The data has a constant trend.
The average number of casualties per 1,000 fires is 14. This indicator was the highest - 66 in 2017, and the lowest 0 in 2002. The trend for casualties per 1,000 fire incidents is constant. Compared to the state value the number of injuries per 1,000 fires is much higher.Casualties per 1,000 incidents in Huntington, IN compared to nearest cities:
(Note: Based on data for all years, including only cities with at least 500 fire incidents)
| Huntington: | 14.6 |
| North Manchester: | 2.0 |
| Wabash: | 10.1 |
| Columbia City: | 0.6 |
| Bluffton: | 7.5 |
| Fort Wayne: | 16.3 |
| Pierceton: | 1.4 |
| Marion: | 3.8 |
| New Haven: | 14.5 |
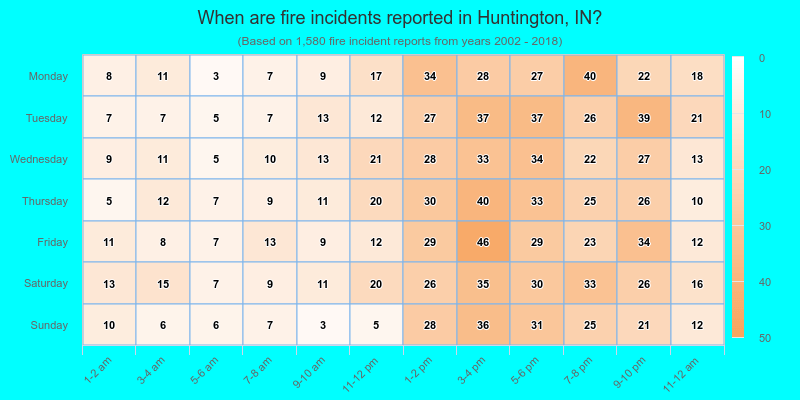
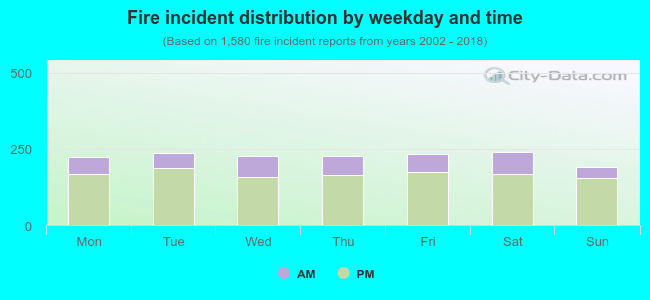 26.0% incidents where reported in the morning and 74.0% in the evening. The most fires (15.3%) took place on Saturday, and the least (12.0%) on Sunday.
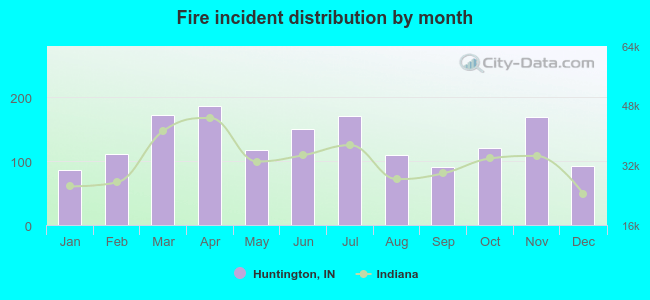 According to the 1,580 reports from years 2002 - 2018 most fires (11.8%) took place during April, and the least (5.4%) in January.
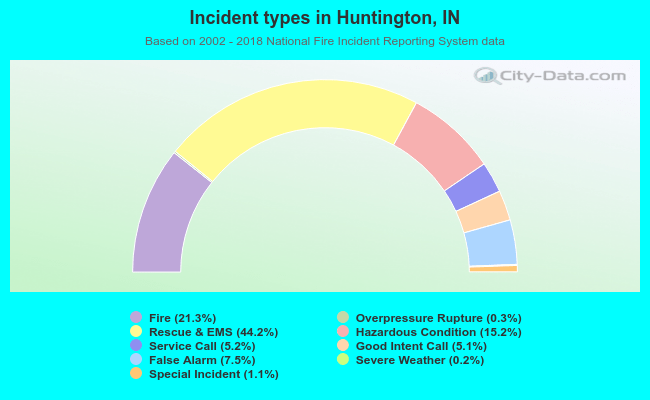 Out of all 7,417 cases reported during the years 2002 - 2018, the most belonged to the categories: Rescue & EMS (44.2%), Fire (21.3%), and Hazardous Condition (15.2%).
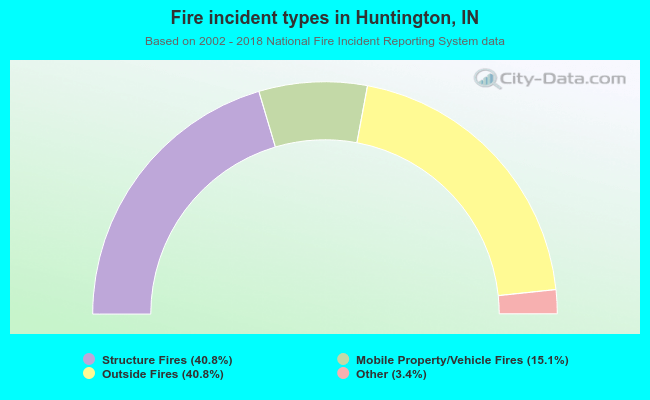 When looking into fire subcategories, the most reports belonged to: Structure Fires (40.8%), and Outside Fires (40.8%).