O'Fallon: Fire Incidents, Missouri (MO)
Where are fire incidents reported in O'Fallon, MO
Something went wrong! Please refresh the page.
| Fire incidents reported | |
|---|---|
| Sreet name | Count |
| HIGHWAY K | 158 |
| I-70 | 106 |
| HIGHWAY 79 | 56 |
| VETERANS MEMORIAL PKY | 52 |
| BRYAN RD | 46 |
| MEXICO RD | 40 |
| MAIN ST | 34 |
| WOODLAWN AVE | 32 |
| DALBOW RD | 30 |
| HIGHWAY N | 28 |
| FEISE RD | 26 |
| HIGHWAY P | 26 |
| HWY. K | 24 |
| PLACKEMEIER DR | 24 |
| SONDEREN ST | 24 |
| BARBERRY LANE | 22 |
| PRINCE RUPPERT DR | 20 |
| STONE CREEK VALLEY CIR | 20 |
| TERRA LN | 20 |
| TWIN CHIMNEYS BLVD | 20 |
| WOODCREST BLVD | 20 |
| W TERRA LANE | 18 |
| CASALON DR | 16 |
| COUNTRY LIFE DR | 16 |
| KEMMAR CT | 16 |
| KOCH RD | 16 |
| PERUQUE CREEK RD | 16 |
| TOM GINNEVER AVE | 16 |
| WEST TERRA LN | 16 |
| WESTRIDGE DR | 16 |
| Other | 927 |
2002 - 2011 National Fire Incident Reporting System (NFIRS) incidents
- Incident types reported to NFIRS in O`Fallon, MO
- 2,91731.4%Rescue & EMS
- 2,11822.8%Hazardous Condition
- 1,90120.5%Fire
- 94210.1%Good Intent Call
- 7478.0%False Alarm
- 6146.6%Service Call
- 320.3%Overpressure Rupture
- 210.2%Severe Weather
- Fire incident types reported to NFIRS in O`Fallon, MO
- 85044.7%Structure Fires
- 71637.7%Outside Fires
- 31716.7%Mobile Property/Vehicle Fires
- 180.9%Other
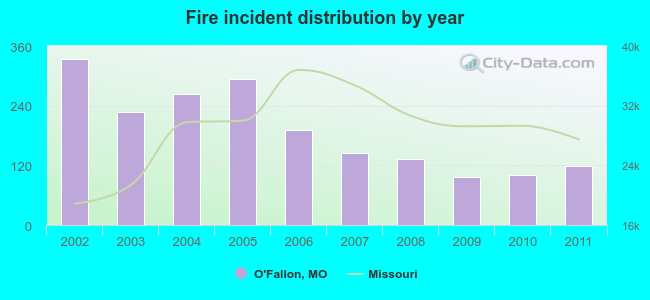 Based on the data from the years 2002 - 2011 the average number of fires per year is 190. The highest number of fire incidents - 333 took place in 2002, and the least - 97 in 2009. The data has a dropping trend.
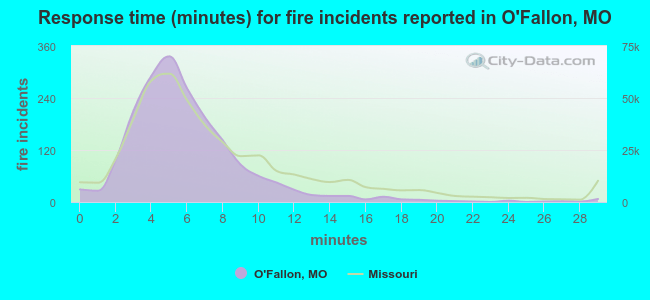 The median response time based on all reported fire incidents is 5 minutes. This is lower than the Missouri median value.
The median response time in O`Fallon, MO compared to nearest cities:
(Note: Based on data for all years, including only cities with at least 500 fire incidents)
| O'Fallon: | 5 minutes |
| St. Peters: | 6 minutes |
| Wentzville: | 8 minutes |
| St. Charles: | 6 minutes |
| Chesterfield: | 6 minutes |
| Wildwood: | 6 minutes |
| Ellisville: | 4 minutes |
| Maryland Heights: | 5 minutes |
| Winfield: | 10 minutes |
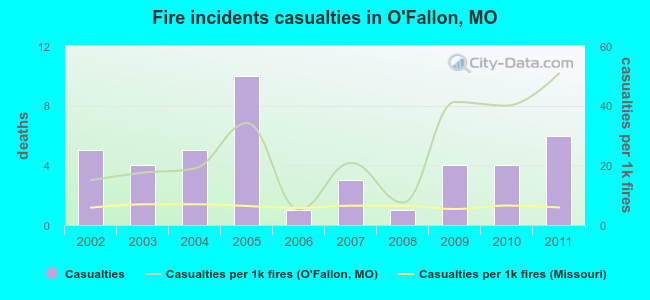 Based on the reports from the years 2002 - 2011 the average number of fire-related yearly casualties is 4. The highest number of reported injuries - 10 took place in 2005, and the lowest - 1 in 2006. The data has a growing trend.
The average number of casualties per 1,000 fires is 25. This indicator was the highest - 51 in 2011, and the lowest 5 in 2006. The trend for casualties per 1,000 fires is growing. Compared to the state value the number of casualties per 1,000 fires is much higher.
Based on the reports from the years 2002 - 2011 the average number of fire-related yearly casualties is 4. The highest number of reported injuries - 10 took place in 2005, and the lowest - 1 in 2006. The data has a growing trend.
The average number of casualties per 1,000 fires is 25. This indicator was the highest - 51 in 2011, and the lowest 5 in 2006. The trend for casualties per 1,000 fires is growing. Compared to the state value the number of casualties per 1,000 fires is much higher.Casualties per 1,000 incidents in O`Fallon, MO compared to nearest cities:
(Note: Based on data for all years, including only cities with at least 500 fire incidents)
| O'Fallon: | 22.6 |
| St. Peters: | 9.4 |
| Wentzville: | 12.7 |
| St. Charles: | 8.3 |
| Chesterfield: | 7.0 |
| Wildwood: | 4.2 |
| Ellisville: | 12.1 |
| Maryland Heights: | 4.0 |
| Winfield: | 5.6 |
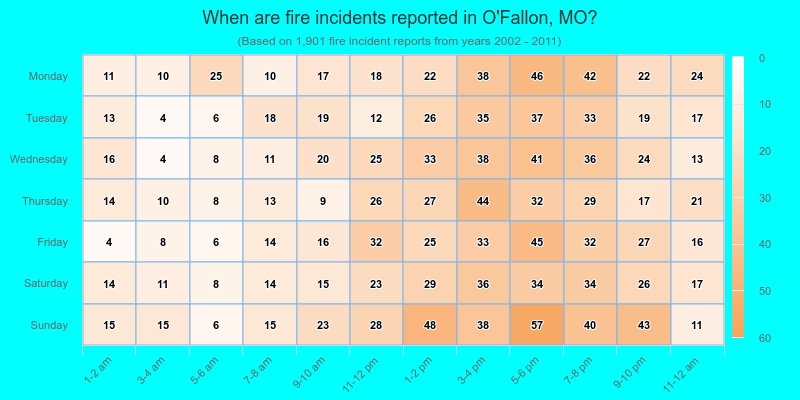
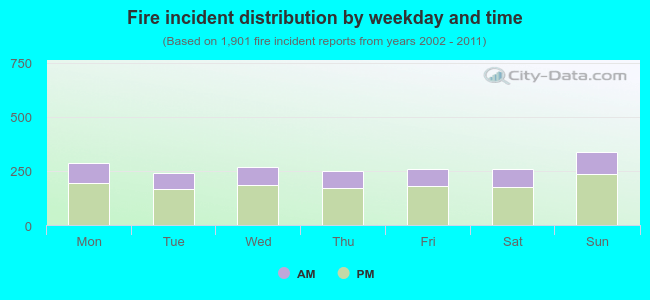 31.2% incidents where reported in the morning and 68.8% in the evening. The most fires (17.8%) took place on Sunday, and the least (12.6%) on Tuesday.
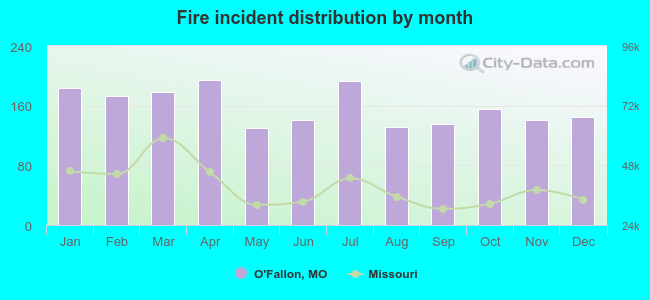 Based on the 1,901 fire incident reports from years 2002 - 2011 most fires (10.2%) took place during April, and the least (6.8%) in May.
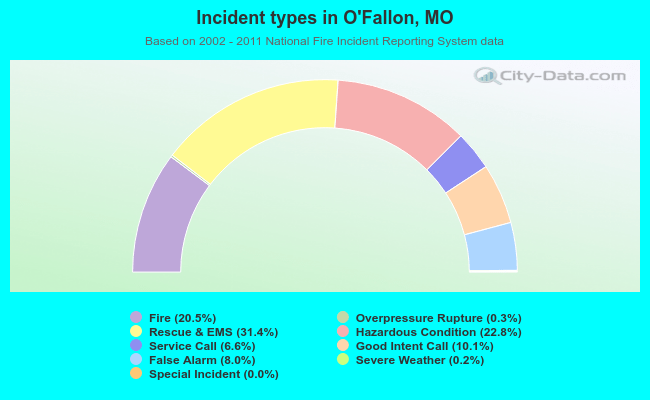 Out of all 9,294 cases reported during the years 2002 - 2011, the most belonged to the categories: Rescue & EMS (31.4%), Hazardous Condition (22.8%), and Fire (20.5%).
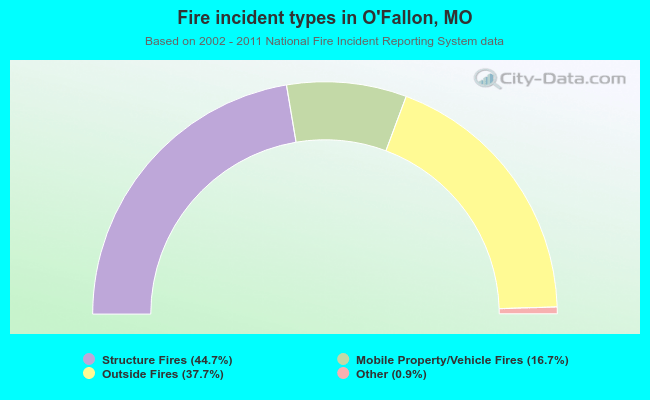 When looking into fire subcategories, the most incidents belonged to: Structure Fires (44.7%), and Outside Fires (37.7%).