Mobile: Fire Incidents, Alabama (AL)
Where are fire incidents reported in Mobile, AL
Something went wrong! Please refresh the page.
| Fire incidents reported | |
|---|---|
| Sreet name | Count |
| AIRPORT BLVD | 1,036 |
| SPRING HILL AVE | 375 |
| OLD SHELL RD | 365 |
| DAUPHIN ISLAND PKWY | 335 |
| I-10 | 335 |
| MOFFETT RD | 330 |
| AZALEA RD | 310 |
| COTTAGE HILL RD | 305 |
| I-65 | 305 |
| GOVERNMENT BLVD | 295 |
| HWY 90 | 295 |
| DAUPHIN ST | 270 |
| HILLCREST RD | 235 |
| BAY BRIDGE RD | 205 |
| BAY SHORE AVE | 205 |
| GOVERNMENT ST | 205 |
| BROAD ST | 200 |
| HALLS MILL RD | 195 |
| RANGELINE RD | 190 |
| UNIVERSITY BLVD | 190 |
| I-65 SERVICE RD | 175 |
| ST STEPHENS RD | 170 |
| SCHILLINGER RD | 159 |
| GRAND BAY WILMER RD | 153 |
| KNOLLWOOD DR | 149 |
| JEFF HAMILTON RD | 143 |
| PLEASANT VALLEY RD | 140 |
| MICHIGAN AVE | 135 |
| ZEIGLER BLVD | 135 |
| CONCEPTION STREET RD | 130 |
2005 - 2018 National Fire Incident Reporting System (NFIRS) incidents
- Incident types reported to NFIRS in Mobile, AL
- 42,75370.5%Rescue & EMS
- 6,69011.0%Fire
- 4,4497.3%Good Intent Call
- 2,9464.9%False Alarm
- 2,2783.8%Hazardous Condition
- 1,4572.4%Service Call
- Fire incident types reported to NFIRS in Mobile, AL
- 2,58238.6%Structure Fires
- 2,48737.2%Outside Fires
- 1,21318.1%Mobile Property/Vehicle Fires
- 4086.1%Other
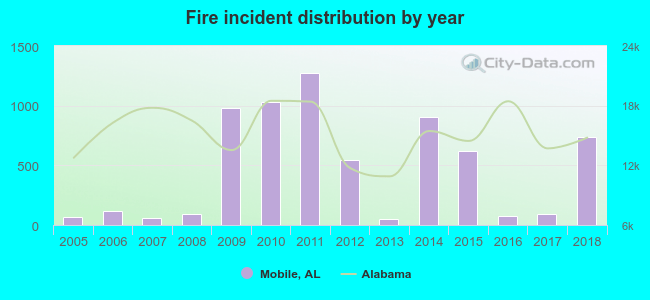 According to the data from the years 2005 - 2018 the average number of fire incidents per year is 475. The highest number of reported fires - 1,272 took place in 2011, and the least - 54 in 2013. The data has an increasing trend.
The average number of yearly fire incidents per 10k residents in Mobile, AL compared to nearest cities:
(Note: Based on data for the last 3 years, including only cities with population 5,000 and above)
| Mobile: | 15.4 |
| Prichard: | 37.1 |
| Chickasaw: | 1.7 |
| Theodore: | 115.3 |
| Saraland: | 41.2 |
| Spanish Fort: | 34.2 |
| Satsuma: | 58.4 |
| Daphne: | 35.3 |
| Semmes: | 45.4 |
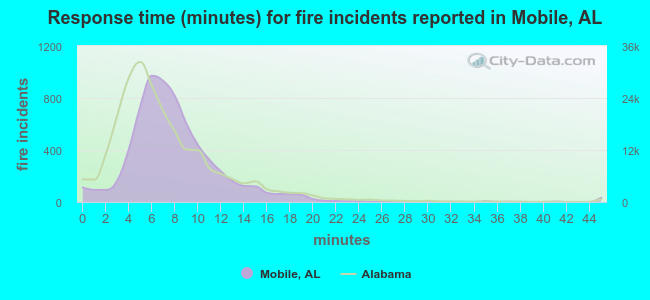 The median response time based on all reported fire incidents is 7 minutes. This is about the same as the Alabama median value.
The median response time in Mobile, AL compared to nearest cities:
(Note: Based on data for all years, including only cities with at least 500 fire incidents)
| Mobile: | 7 minutes |
| Prichard: | 5 minutes |
| Theodore: | 7 minutes |
| Saraland: | 5 minutes |
| Satsuma: | 4 minutes |
| Daphne: | 6 minutes |
| Semmes: | 8 minutes |
| Fairhope: | 8 minutes |
| Bay Minette: | 5 minutes |
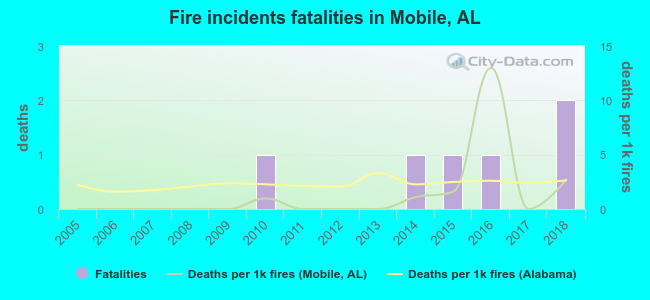 According to the reports from the years 2005 - 2018 the average number of fire-related yearly deaths is 0. The highest number of deaths - 2 took place in 2018, and the lowest - 0 in 2005. The data has a growing trend.
The average number of deaths per 1,000 fire incidents is 1. This indicator was the highest - 13 in 2016, and the lowest 0 in 2005. The trend for fatalities per 1,000 fires is rising. Compared to the Alabama value the number of deaths per 1,000 incidents is much lower.
According to the reports from the years 2005 - 2018 the average number of fire-related yearly deaths is 0. The highest number of deaths - 2 took place in 2018, and the lowest - 0 in 2005. The data has a growing trend.
The average number of deaths per 1,000 fire incidents is 1. This indicator was the highest - 13 in 2016, and the lowest 0 in 2005. The trend for fatalities per 1,000 fires is rising. Compared to the Alabama value the number of deaths per 1,000 incidents is much lower.Deaths per 1,000 incidents in Mobile, AL compared to nearest cities:
(Note: Based on data for all years, including only cities with at least 2,500 fire incidents)
| Mobile: | 0.9 |
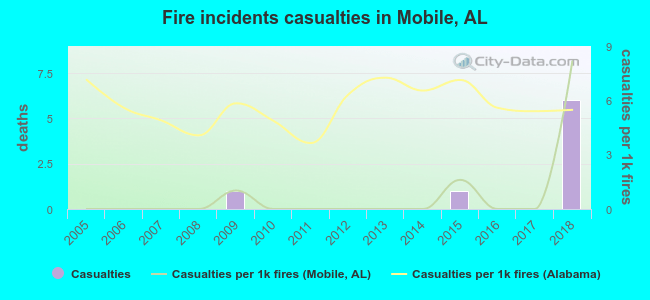 According to the reports from the years 2005 - 2018 the average number of fire-related casualties per year is 1. The highest number of reported injuries - 6 took place in 2018, and the lowest - 0 in 2005. The data has a rising trend.
The average number of injuries per 1,000 fire incidents is 1. This indicator was the highest - 8 in 2018, and the lowest 0 in 2005. The trend for casualties per 1,000 incidents is growing. Compared to the Alabama value the number of casualties per 1,000 fire incidents is much lower.
According to the reports from the years 2005 - 2018 the average number of fire-related casualties per year is 1. The highest number of reported injuries - 6 took place in 2018, and the lowest - 0 in 2005. The data has a rising trend.
The average number of injuries per 1,000 fire incidents is 1. This indicator was the highest - 8 in 2018, and the lowest 0 in 2005. The trend for casualties per 1,000 incidents is growing. Compared to the Alabama value the number of casualties per 1,000 fire incidents is much lower.
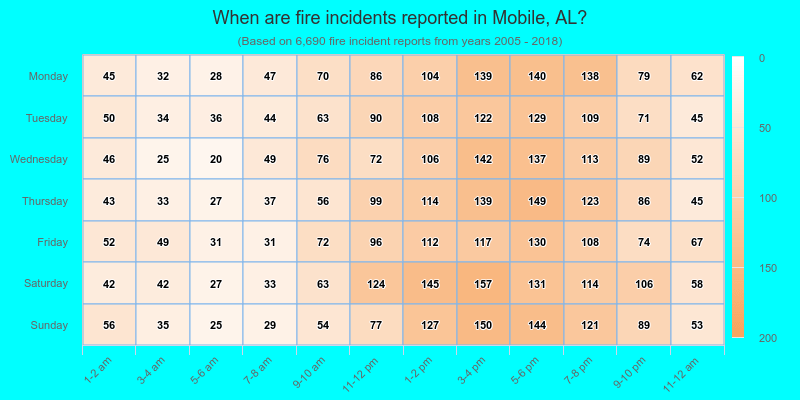
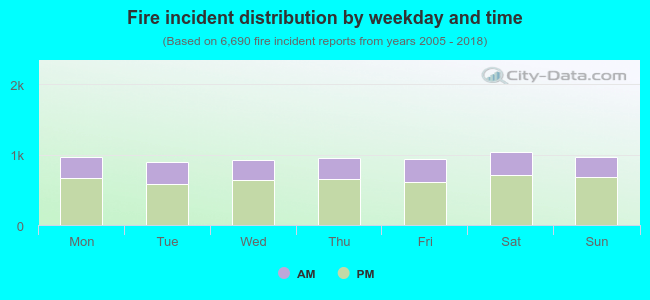 32.1% incidents where reported in the morning and 67.9% in the evening. The most fires (15.6%) took place on Saturday, and the least (13.5%) on Tuesday.
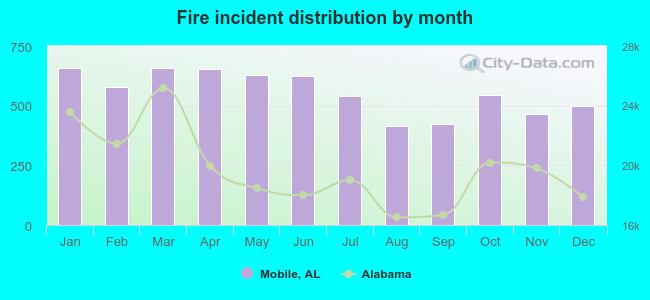 According to the 6,690 fire incidents from years 2005 - 2018 most fires (9.9%) took place during January, and the least (6.2%) in August.
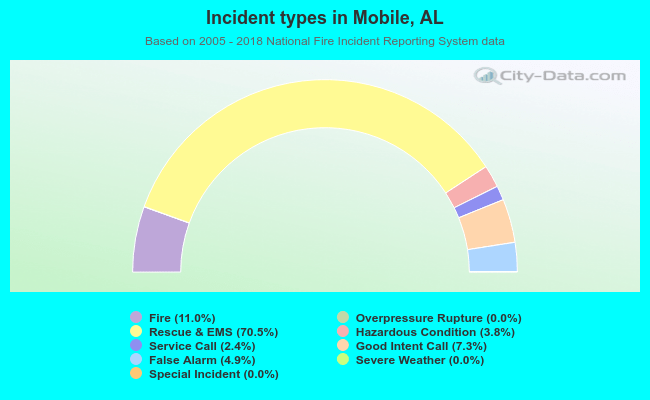 Out of all 60,628 cases reported during the years 2005 - 2018, the most belonged to the categories: Rescue & EMS (70.5%), Fire (11.0%), and Good Intent Call (7.3%).
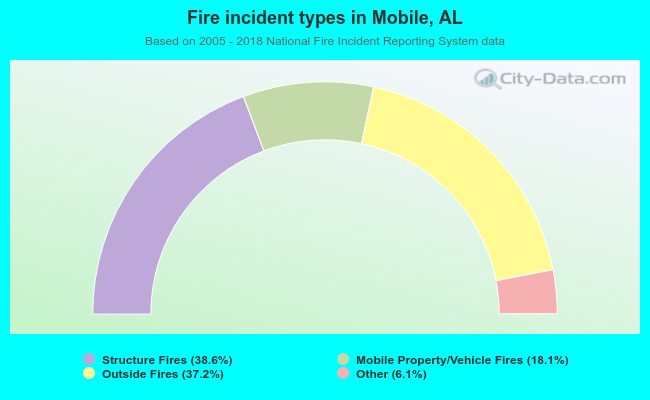 When looking into fire subcategories, the most incidents belonged to: Structure Fires (38.6%), and Outside Fires (37.2%).