Oceanport: Fire Incidents, New Jersey (NJ)
Where are fire incidents reported in Oceanport, NJ
Something went wrong! Please refresh the page.
|
| |||||||||||||||||||||||||||||||||||||||||||||||||||||||||||||||||||||||||||||||||||||||||||||||||||||||||||||
2004 - 2018 National Fire Incident Reporting System (NFIRS) incidents
- Incident types reported to NFIRS in Oceanport, NJ
- 54841.0%Hazardous Condition
- 28121.0%False Alarm
- 23617.7%Fire
- 13810.3%Good Intent Call
- 735.5%Rescue & EMS
- 453.4%Service Call
- 151.1%Special Incident
- Fire incident types reported to NFIRS in Oceanport, NJ
- 14159.7%Structure Fires
- 6527.5%Outside Fires
- 187.6%Mobile Property/Vehicle Fires
- 125.1%Other
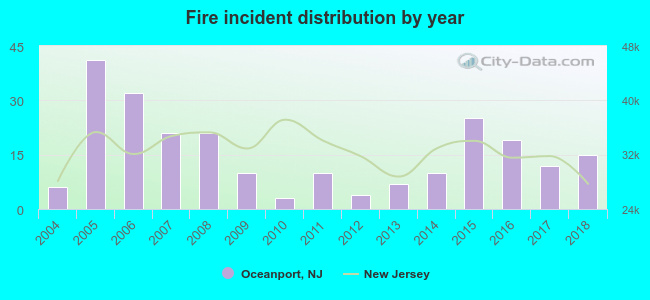 According to the data from the years 2004 - 2018 the average number of fire incidents per year is 16. The highest number of reported fire incidents - 41 took place in 2005, and the least - 3 in 2010. The data has a growing trend.
The average number of yearly fire incidents per 10k residents in Oceanport, NJ compared to nearest cities:
(Note: Based on data for the last 3 years, including only cities with population 5,000 and above)
| Oceanport: | 26.3 |
| Little Silver: | 11.3 |
| Long Branch: | 29.6 |
| West Long Branch: | 4.2 |
| Eatontown: | 35.6 |
| Fair Haven: | 13.2 |
| Red Bank: | 28.4 |
| Rumson: | 33.0 |
| Tinton Falls: | 47.9 |

 26.7% incidents where reported in the morning and 73.3% in the evening. The most fires (19.5%) took place on Monday, and the least (9.3%) on Wednesday.
 Based on the 236 fire incident reports from years 2004 - 2018 most fires (10.6%) took place during March, and the least (5.9%) in January.
 Out of all 1,336 cases reported during the years 2004 - 2018, the most belonged to the categories: Rescue & EMS (41.0%), Good Intent Call (21.0%), and Fire (17.7%).
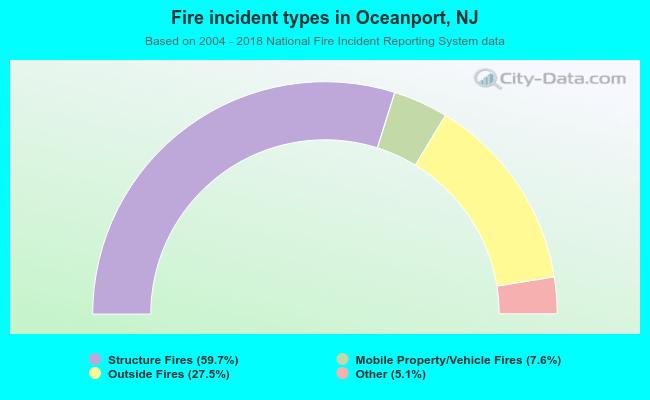 When looking into fire subcategories, the most reports belonged to: Structure Fires (59.7%), and Outside Fires (27.5%).