West Long Branch: Fire Incidents, New Jersey (NJ)
Where are fire incidents reported in West Long Branch, NJ
Something went wrong! Please refresh the page.
|
| |||||||||||||||||||||||||||||||||||||||||||||||||||||||||||||||||||||||||||||||||||||||||||||||||||||||||||||
2005 - 2018 National Fire Incident Reporting System (NFIRS) incidents
- Incident types reported to NFIRS in West Long Branch, NJ
- 57648.5%Fire
- 50442.4%Hazardous Condition
- 524.4%False Alarm
- 221.9%Good Intent Call
- 211.8%Service Call
- 80.7%Rescue & EMS
- 20.2%Overpressure Rupture
- 20.2%Special Incident
- Fire incident types reported to NFIRS in West Long Branch, NJ
- 47682.6%Structure Fires
- 6711.6%Outside Fires
- 315.4%Mobile Property/Vehicle Fires
- 20.3%Other
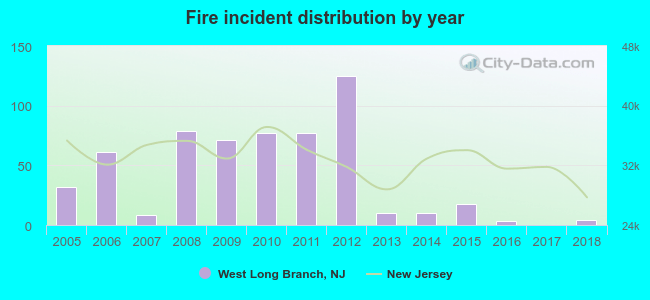 Based on the data from the years 2005 - 2018 the average number of fire incidents per year is 41. The highest number of fire incidents - 125 took place in 2012, and the least - 0 in 2017. The data has a declining trend.
The average number of yearly fire incidents per 10k residents in West Long Branch, NJ compared to nearest cities:
(Note: Based on data for the last 3 years, including only cities with population 5,000 and above)
| West Long Branch: | 4.2 |
| Long Branch: | 29.6 |
| Oceanport: | 26.3 |
| Eatontown: | 35.6 |
| Little Silver: | 11.3 |
| Tinton Falls: | 47.9 |
| Asbury Park: | 53.2 |
| Red Bank: | 28.4 |
| Fair Haven: | 13.2 |
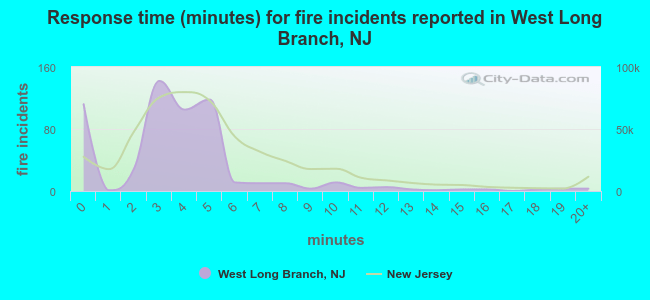 The median response time based on all reported fire incidents is 4 minutes. This is lower than the state median value.
The median response time in West Long Branch, NJ compared to nearest cities:
(Note: Based on data for all years, including only cities with at least 500 fire incidents)
| West Long Branch: | 4 minutes |
| Long Branch: | 3 minutes |
| Oakhurst: | 5 minutes |
| Eatontown: | 5 minutes |
| Tinton Falls: | 7 minutes |
| Asbury Park: | 3 minutes |
| Manasquan: | 5 minutes |
| Freehold: | 5 minutes |
| Keyport: | 4 minutes |
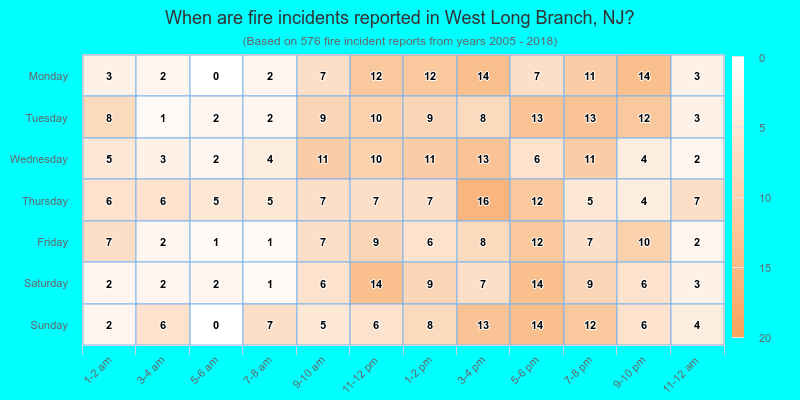
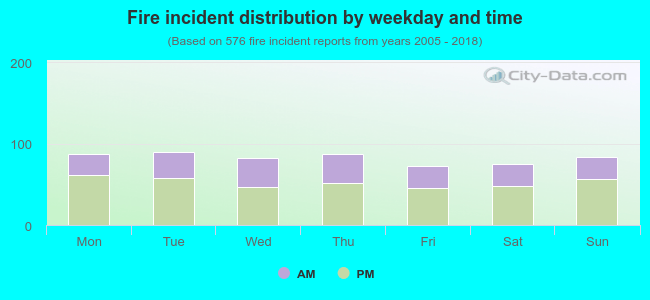 36.3% incidents where reported in the morning and 63.7% in the evening. The most fires (15.6%) took place on Tuesday, and the least (12.5%) on Friday.
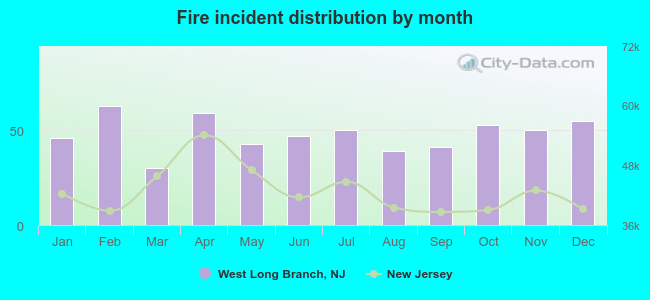 According to the 576 fires from years 2005 - 2018 most fires (10.9%) took place during February, and the least (5.2%) in March.
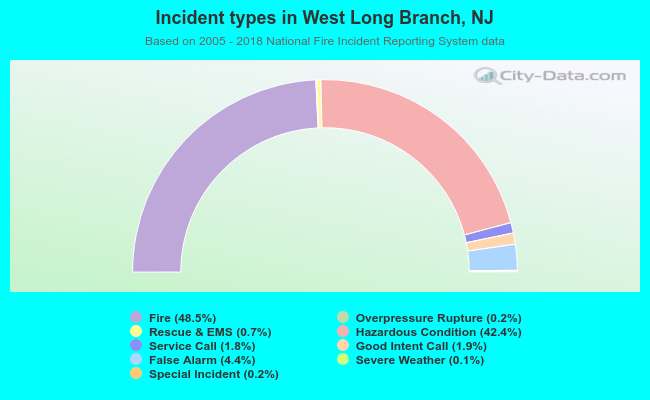 Out of all 1,188 cases reported during the years 2005 - 2018, the most belonged to the categories: Fire (48.5%), Hazardous Condition (42.4%), and False Alarm (4.4%).
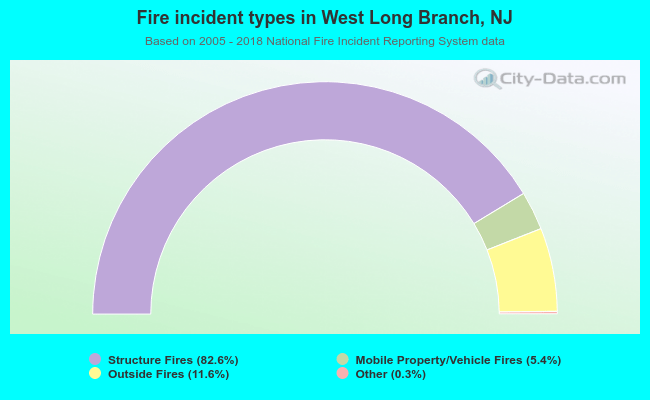 When looking into fire subcategories, the most reports belonged to: Structure Fires (82.6%), and Outside Fires (11.6%).