Tinton Falls: Fire Incidents, New Jersey (NJ)
Where are fire incidents reported in Tinton Falls, NJ
Something went wrong! Please refresh the page.
| Fire incidents reported | |
|---|---|
| Sreet name | Count |
| SHAFTO RD | 130 |
| ASBURY AVE | 102 |
| WAYSIDE RD | 92 |
| SHREWSBURY AVE | 86 |
| HOPE RD | 76 |
| ESSEX RD | 74 |
| ROUTE 33 | 74 |
| GSP LOC SB | 56 |
| SYCAMORE AVE | 56 |
| GARDEN STATE PKY | 54 |
| PINE ST | 50 |
| PREMIUM OUTLETS BLVD | 48 |
| GSP LOC NB | 44 |
| HANCE AVE | 36 |
| GARDEN STATE PARKWAY | 32 |
| PARK RD | 32 |
| WILLIAM ST | 32 |
| GARDEN STATE PARKWAY N. | 30 |
| REEDS RD | 26 |
| TINTON AVE | 26 |
| WARDELL RD | 26 |
| AUTUMN DR | 24 |
| PREMIUM OUTLET BLVD | 24 |
| GREEN GROVE RD | 22 |
| RIVEREDGE RD | 22 |
| NEWMAN SPRINGS RD | 20 |
| GARDEN STATE PARKWAY S. | 18 |
| GILBERT ST | 18 |
| SOCIETY HILL WAY | 18 |
| BEAUMONT CT | 16 |
2003 - 2018 National Fire Incident Reporting System (NFIRS) incidents
- Incident types reported to NFIRS in Tinton Falls, NJ
- 1,94328.4%Good Intent Call
- 1,62323.7%Hazardous Condition
- 1,45221.2%False Alarm
- 1,28318.8%Fire
- 3395.0%Rescue & EMS
- 1802.6%Service Call
- 150.2%Overpressure Rupture
- Fire incident types reported to NFIRS in Tinton Falls, NJ
- 55243.0%Structure Fires
- 37028.8%Outside Fires
- 29523.0%Mobile Property/Vehicle Fires
- 665.1%Other
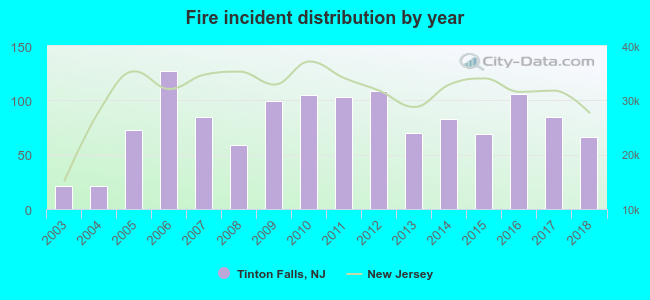 Based on the data from the years 2003 - 2018 the average number of fire incidents per year is 80. The highest number of reported fire incidents - 127 took place in 2006, and the least - 21 in 2003. The data has a rising trend.
The average number of yearly fire incidents per 10k residents in Tinton Falls, NJ compared to nearest cities:
(Note: Based on data for the last 3 years, including only cities with population 5,000 and above)
| Tinton Falls: | 47.9 |
| Eatontown: | 35.6 |
| West Long Branch: | 4.2 |
| Lincroft: | 19.6 |
| Little Silver: | 11.3 |
| Oceanport: | 26.3 |
| Red Bank: | 28.4 |
| Long Branch: | 29.6 |
| Asbury Park: | 53.2 |
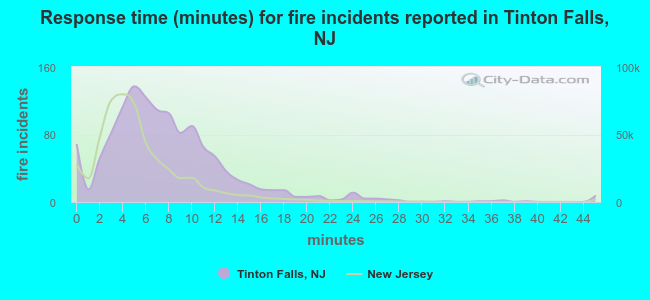 The median response time based on all reported fire incidents is 7 minutes. This is higher than the New Jersey median value.
The median response time in Tinton Falls, NJ compared to nearest cities:
(Note: Based on data for all years, including only cities with at least 500 fire incidents)
| Tinton Falls: | 7 minutes |
| Eatontown: | 5 minutes |
| Oakhurst: | 5 minutes |
| West Long Branch: | 4 minutes |
| Long Branch: | 3 minutes |
| Asbury Park: | 3 minutes |
| Freehold: | 5 minutes |
| Manasquan: | 5 minutes |
| Morganville: | 4 minutes |
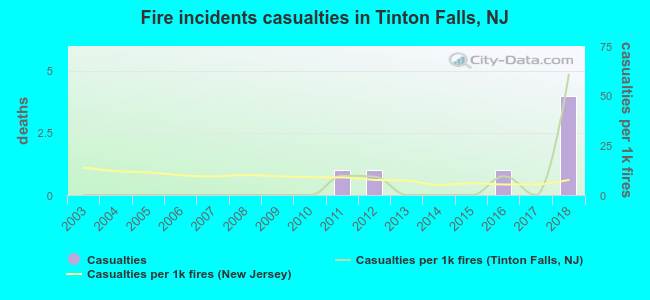 Based on the reports from the years 2003 - 2018 the average number of fire-related yearly casualties is 0. The highest number of casualties - 4 took place in 2018, and the lowest - 0 in 2003. The data has a growing trend.
The average number of injuries per 1,000 fires is 6. This indicator was the highest - 61 in 2018, and the lowest 0 in 2003. The trend for casualties per 1,000 fires is rising. Compared to the New Jersey value the number of casualties per 1,000 incidents is lower.
Based on the reports from the years 2003 - 2018 the average number of fire-related yearly casualties is 0. The highest number of casualties - 4 took place in 2018, and the lowest - 0 in 2003. The data has a growing trend.
The average number of injuries per 1,000 fires is 6. This indicator was the highest - 61 in 2018, and the lowest 0 in 2003. The trend for casualties per 1,000 fires is rising. Compared to the New Jersey value the number of casualties per 1,000 incidents is lower.Casualties per 1,000 incidents in Tinton Falls, NJ compared to nearest cities:
(Note: Based on data for all years, including only cities with at least 500 fire incidents)
| Tinton Falls: | 5.5 |
| Eatontown: | 26.9 |
| Oakhurst: | 5.8 |
| West Long Branch: | 0.0 |
| Long Branch: | 7.6 |
| Asbury Park: | 11.6 |
| Freehold: | 3.1 |
| Manasquan: | 7.1 |
| Morganville: | 1.7 |
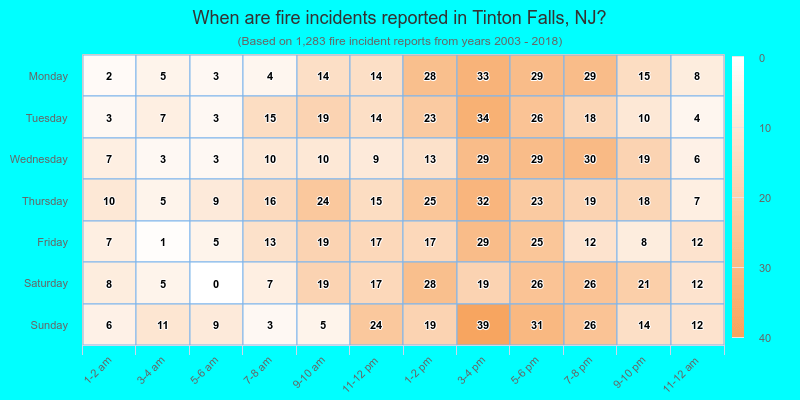
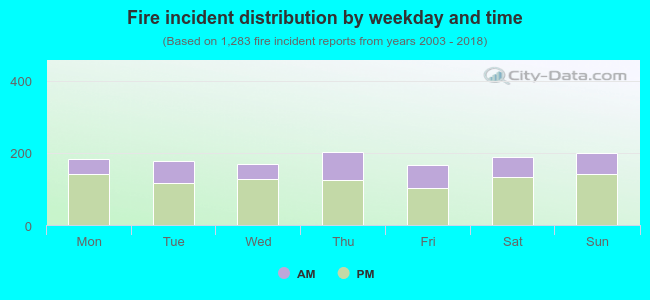 31.2% incidents where reported in the morning and 68.8% in the evening. The most fires (15.8%) took place on Thursday, and the least (12.9%) on Friday.
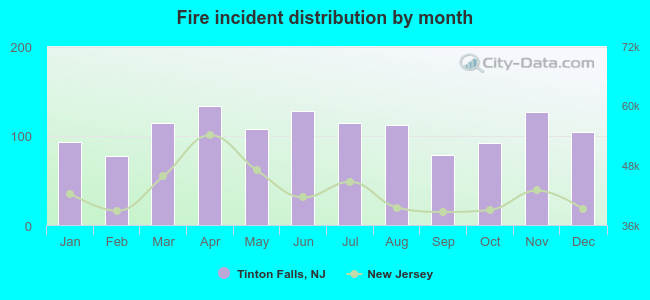 According to the 1,283 reports from years 2003 - 2018 most fires (10.4%) took place during April, and the least (6.0%) in February.
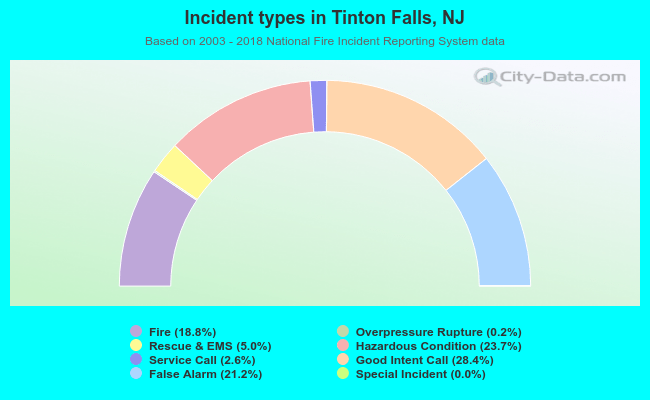 Out of all 6,836 cases reported during the years 2003 - 2018, the most belonged to the categories: Good Intent Call (28.4%), Hazardous Condition (23.7%), and False Alarm (21.2%).
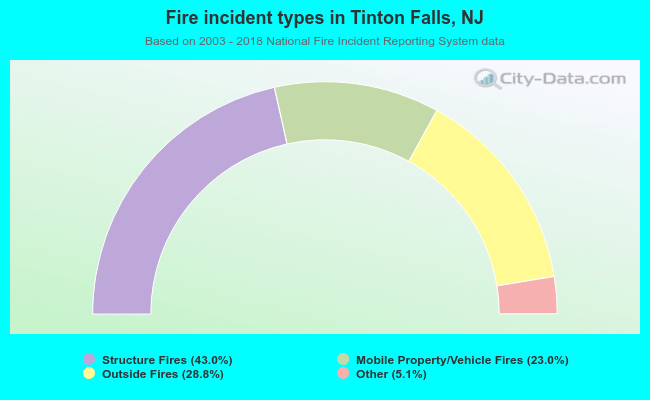 When looking into fire subcategories, the most reports belonged to: Structure Fires (43.0%), and Outside Fires (28.8%).