Oswego: Fire Incidents, New York (NY)
Where are fire incidents reported in Oswego, NY
Something went wrong! Please refresh the page.
| Fire incidents reported | |
|---|---|
| Sreet name | Count |
| BRIDGE ST | 98 |
| SENECA ST | 60 |
| ST RT 104 | 58 |
| ST. RT. 104 | 54 |
| 1ST ST | 48 |
| STATE HWY 104 HWY | 46 |
| MIDDLE RD | 44 |
| CAYUGA ST | 42 |
| 5TH ST | 38 |
| 3RD ST | 36 |
| 7TH ST | 34 |
| RATHBURN RD | 34 |
| 8TH ST | 30 |
| STATE ROUTE 104 | 28 |
| 4TH ST | 26 |
| 9TH ST | 26 |
| UTICA ST | 26 |
| 6TH ST | 24 |
| DUER ST | 24 |
| STATE HWY 104 | 24 |
| ALBANY ST | 22 |
| CO RTE 1 HWY | 22 |
| ONTARIO ST | 22 |
| 2ND ST | 20 |
| CO RT 7 | 20 |
| LIBERTY ST | 20 |
| ONEIDA ST | 20 |
| RIVER RD | 20 |
| SECOND ST | 20 |
| BIRCH LN | 18 |
| Other | 378 |
2002 - 2018 National Fire Incident Reporting System (NFIRS) incidents
- Incident types reported to NFIRS in Oswego, NY
- 16,41567.9%Rescue & EMS
- 1,8317.6%False Alarm
- 1,8017.4%Good Intent Call
- 1,7507.2%Hazardous Condition
- 1,3825.7%Fire
- 8283.4%Service Call
- 1240.5%Severe Weather
- 370.2%Special Incident
- Fire incident types reported to NFIRS in Oswego, NY
- 85461.8%Structure Fires
- 35725.8%Outside Fires
- 1138.2%Mobile Property/Vehicle Fires
- 584.2%Other
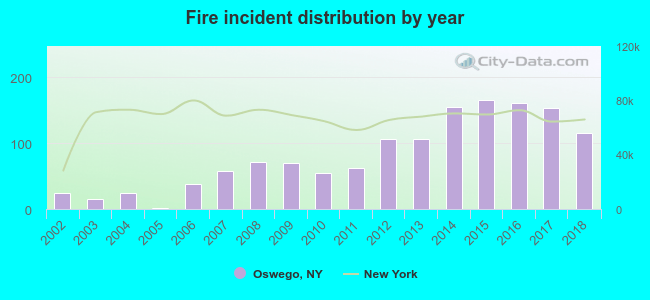 According to the data from the years 2002 - 2018 the average number of fire incidents per year is 81. The highest number of reported fires - 165 took place in 2015, and the least - 1 in 2005. The data has a rising trend.
The average number of yearly fire incidents per 10k residents in Oswego, NY compared to nearest cities:
(Note: Based on data for the last 3 years, including only cities with population 5,000 and above)
| Oswego: | 79.9 |
| Scriba: | 5.8 |
| Volney: | 6.7 |
| Fulton: | 92.4 |
| Granby: | 4.9 |
| Richland: | 22.2 |
| Hastings: | 13.4 |
| Lysander: | 1.4 |
| Baldwinsville: | 90.7 |
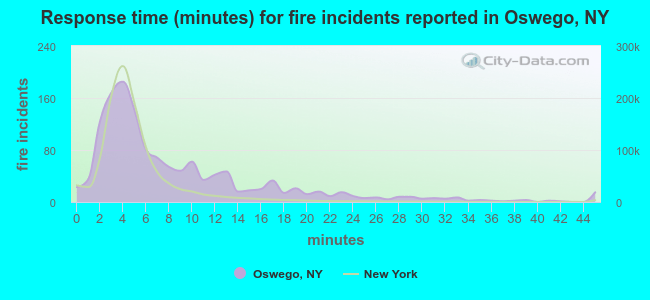 The median response time based on all reported fire incidents is 6 minutes. This is higher compared to the New York median value.
The median response time in Oswego, NY compared to nearest cities:
(Note: Based on data for all years, including only cities with at least 500 fire incidents)
| Oswego: | 6 minutes |
| Fulton: | 7 minutes |
| Central Square: | 10 minutes |
| Baldwinsville: | 8 minutes |
| Clay: | 8 minutes |
| Cicero: | 8 minutes |
| Liverpool: | 7 minutes |
| North Syracuse: | 7 minutes |
| Camillus: | 7 minutes |
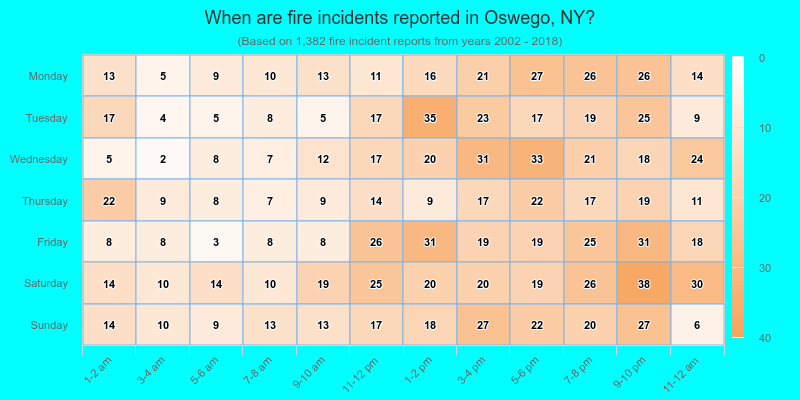
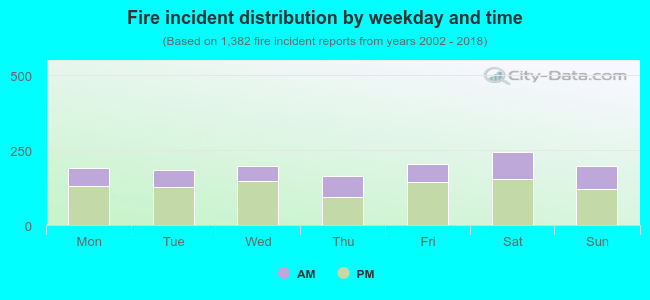 33.7% incidents where reported in the morning and 66.3% in the evening. The most fires (17.7%) took place on Saturday, and the least (11.9%) on Thursday.
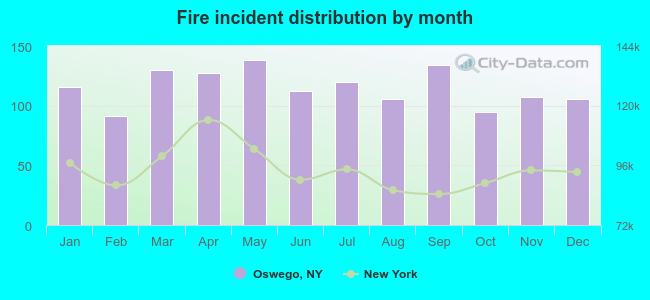 According to the 1,382 fires from years 2002 - 2018 most fires (10.0%) took place during May, and the least (6.6%) in February.
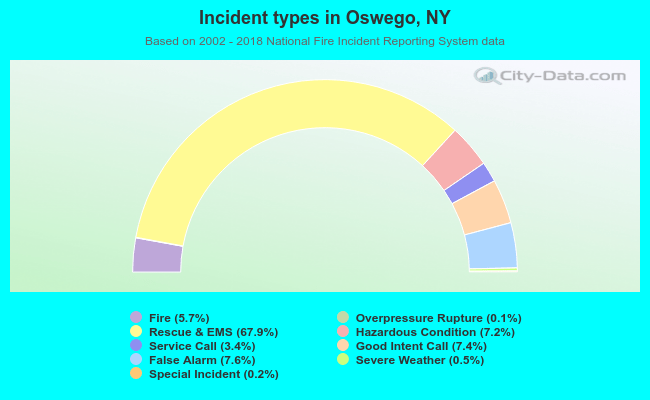 Out of all 24,184 cases reported during the years 2002 - 2018, the most belonged to the categories: Rescue & EMS (67.9%), False Alarm (7.6%), and Good Intent Call (7.4%).
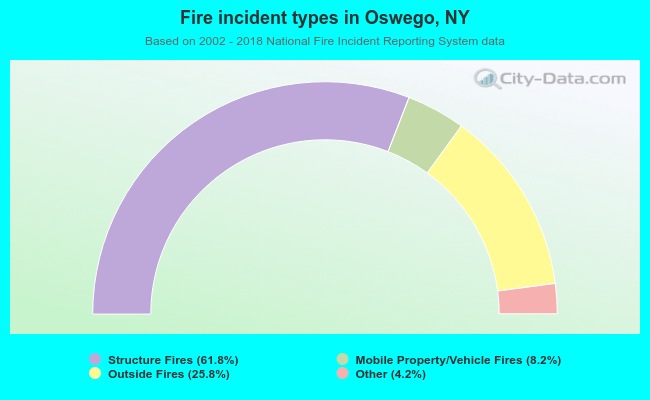 When looking into fire subcategories, the most incidents belonged to: Structure Fires (61.8%), and Outside Fires (25.8%).