Overland Park: Fire Incidents, Kansas (KS)
Where are fire incidents reported in Overland Park, KS
Something went wrong! Please refresh the page.
| Fire incidents reported | |
|---|---|
| Sreet name | Count |
| METCALF AVE | 498 |
| 95TH ST | 330 |
| 135TH ST | 294 |
| COLLEGE BLVD | 218 |
| 119TH ST | 212 |
| 151ST ST | 174 |
| QUIVIRA RD | 150 |
| 106TH ST | 146 |
| LAMAR AVE | 132 |
| 75TH ST | 130 |
| ANTIOCH RD | 120 |
| 91ST ST | 118 |
| FARLEY ST | 112 |
| FOSTER ST | 112 |
| SANTA FE DR | 112 |
| 87TH ST | 108 |
| 115TH ST | 106 |
| 80TH ST | 104 |
| CARTER ST | 100 |
| US HWY 69 | 96 |
| 124TH ST | 88 |
| MARTY ST | 88 |
| NIEMAN RD | 88 |
| 159TH ST | 86 |
| 85TH ST | 86 |
| ROBINSON ST | 84 |
| 103RD ST | 82 |
| 79TH ST | 78 |
| CONSER ST | 78 |
| FLOYD ST | 78 |
| Other | 2,513 |
2002 - 2018 National Fire Incident Reporting System (NFIRS) incidents
- Incident types reported to NFIRS in Overland Park, KS
- 42,09850.4%Rescue & EMS
- 14,20917.0%Good Intent Call
- 7,5779.1%Hazardous Condition
- 6,7218.0%Fire
- 6,6878.0%Service Call
- 6,0317.2%False Alarm
- 1750.2%Overpressure Rupture
- Fire incident types reported to NFIRS in Overland Park, KS
- 3,14346.8%Structure Fires
- 2,37435.3%Outside Fires
- 1,10816.5%Mobile Property/Vehicle Fires
- 961.4%Other
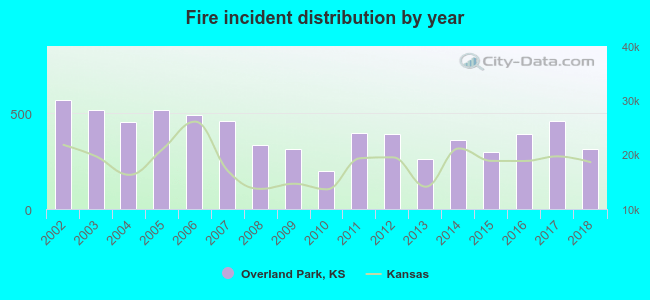 According to the data from the years 2002 - 2018 the average number of fire incidents per year is 395. The highest number of reported fire incidents - 567 took place in 2002, and the least - 197 in 2010. The data has a dropping trend.
The average number of yearly fire incidents per 10k residents in Overland Park, KS compared to nearest cities:
(Note: Based on data for the last 3 years, including only cities with population 5,000 and above)
| Overland Park: | 21.0 |
| Leawood: | 17.8 |
| Prairie Village: | 14.3 |
| Lenexa: | 30.4 |
| Merriam: | 38.7 |
| Mission: | 28.1 |
| Shawnee: | 23.6 |
| Roeland Park: | 22.9 |
| Olathe: | 21.1 |
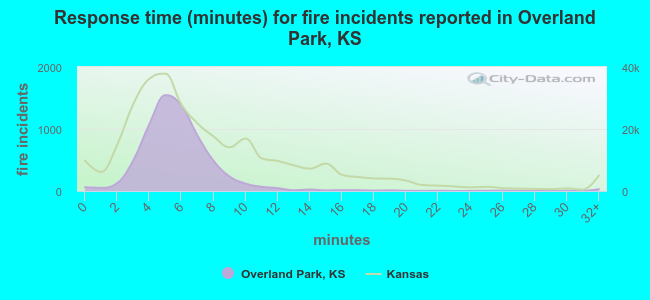 The median response time based on all reported fire incidents is 6 minutes. This is about the same as the Kansas median value.
The median response time in Overland Park, KS compared to nearest cities:
(Note: Based on data for all years, including only cities with at least 500 fire incidents)
| Overland Park: | 6 minutes |
| Leawood: | 5 minutes |
| Lenexa: | 5 minutes |
| Merriam: | 5 minutes |
| Shawnee: | 6 minutes |
| Olathe: | 5 minutes |
| Kansas City: | 5 minutes |
| Bonner Springs: | 8 minutes |
| Gardner: | 6 minutes |
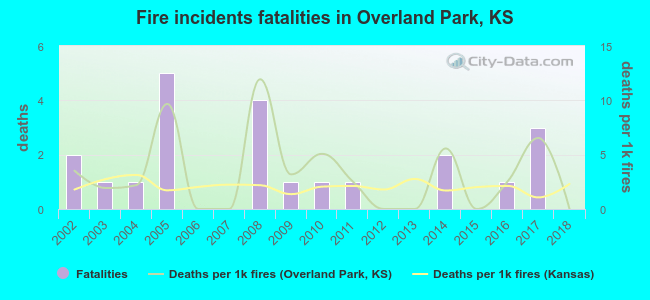 According to the reports from the years 2002 - 2018 the average number of fire-related yearly deaths is 1. The highest number of reported deaths - 5 took place in 2005, and the lowest - 0 in 2006. The data has a declining trend.
The average number of deaths per 1,000 fires is 3. This indicator was the highest - 12 in 2008, and the lowest 0 in 2006. The trend for deaths per 1,000 fires is decreasing. Compared to the state value the number of deaths per 1,000 fire incidents is higher.
According to the reports from the years 2002 - 2018 the average number of fire-related yearly deaths is 1. The highest number of reported deaths - 5 took place in 2005, and the lowest - 0 in 2006. The data has a declining trend.
The average number of deaths per 1,000 fires is 3. This indicator was the highest - 12 in 2008, and the lowest 0 in 2006. The trend for deaths per 1,000 fires is decreasing. Compared to the state value the number of deaths per 1,000 fire incidents is higher.Deaths per 1,000 incidents in Overland Park, KS compared to nearest cities:
(Note: Based on data for all years, including only cities with at least 2,500 fire incidents)
| Overland Park: | 3.3 |
| Lenexa: | 2.4 |
| Olathe: | 2.9 |
| Kansas City: | 4.0 |
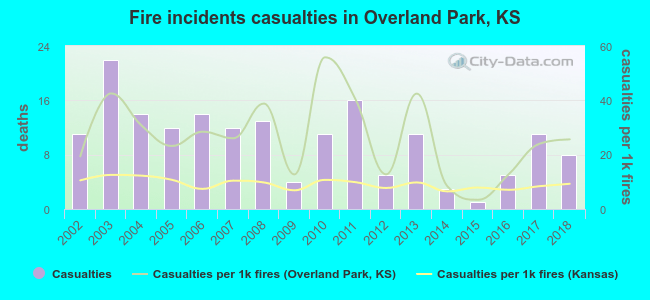 According to the reports from the years 2002 - 2018 the average number of fire-related casualties per year is 10. The highest number of reported injuries - 22 took place in 2003, and the lowest - 1 in 2015. The data has a declining trend.
The average number of injuries per 1,000 fires is 26. This indicator was the highest - 56 in 2010, and the lowest 3 in 2015. The trend for injuries per 1,000 fires is growing. Compared to the state value the number of casualties per 1,000 fire incidents is much higher.
According to the reports from the years 2002 - 2018 the average number of fire-related casualties per year is 10. The highest number of reported injuries - 22 took place in 2003, and the lowest - 1 in 2015. The data has a declining trend.
The average number of injuries per 1,000 fires is 26. This indicator was the highest - 56 in 2010, and the lowest 3 in 2015. The trend for injuries per 1,000 fires is growing. Compared to the state value the number of casualties per 1,000 fire incidents is much higher.Casualties per 1,000 incidents in Overland Park, KS compared to nearest cities:
(Note: Based on data for all years, including only cities with at least 500 fire incidents)
| Overland Park: | 25.7 |
| Leawood: | 8.3 |
| Lenexa: | 17.0 |
| Merriam: | 9.6 |
| Shawnee: | 18.6 |
| Olathe: | 17.6 |
| Kansas City: | 13.3 |
| Bonner Springs: | 5.5 |
| Gardner: | 6.3 |
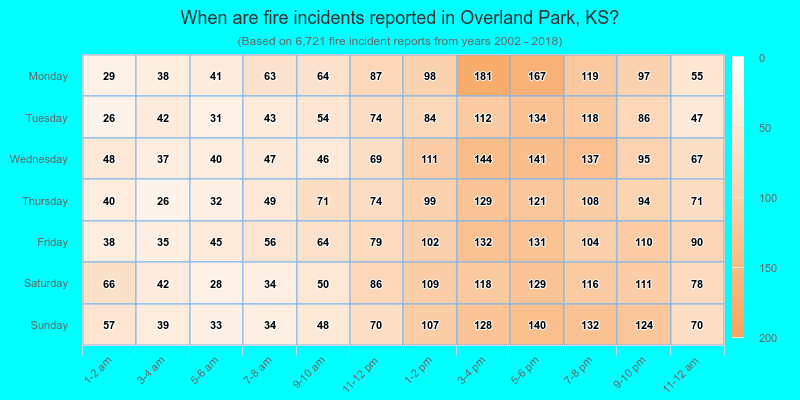
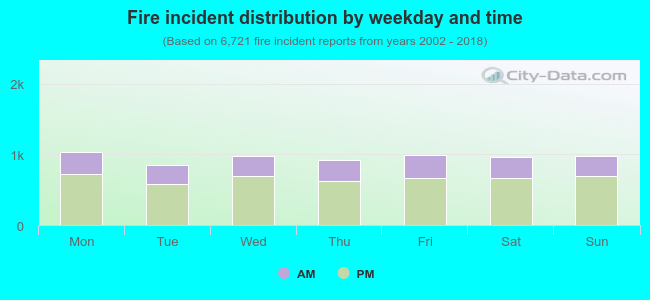 30.9% incidents where reported in the morning and 69.1% in the evening. The most fires (15.5%) took place on Monday, and the least (12.7%) on Tuesday.
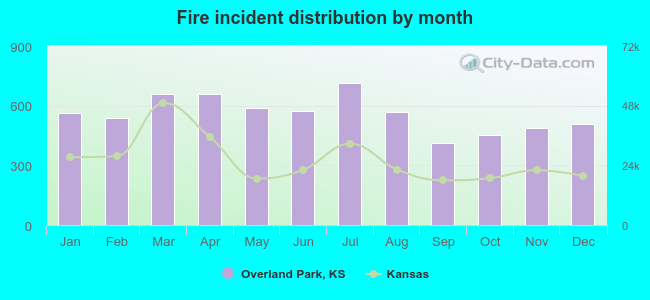 According to the 6,721 fires from years 2002 - 2018 most fires (10.6%) took place during July, and the least (6.1%) in September.
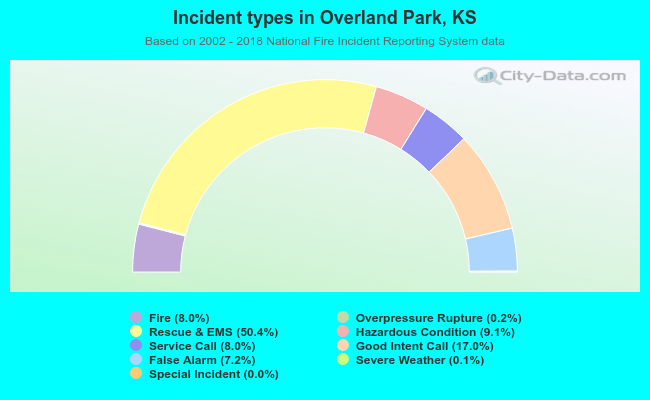 Out of all 83,595 cases reported during the years 2002 - 2018, the most belonged to the categories: Rescue & EMS (50.4%), Good Intent Call (17.0%), and Hazardous Condition (9.1%).
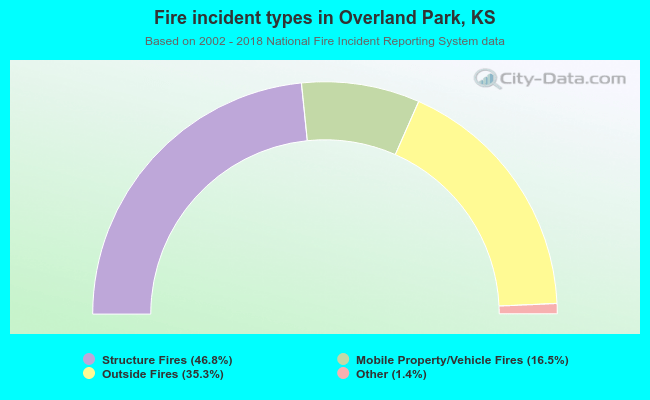 When looking into fire subcategories, the most incidents belonged to: Structure Fires (46.8%), and Outside Fires (35.3%).