Roeland Park: Fire Incidents, Kansas (KS)
Where are fire incidents reported in Roeland Park, KS
Something went wrong! Please refresh the page.
|
| |||||||||||||||||||||||||||||||||||||||||||||||||||||||||||||||||||||||||||||||||||||||||||||||||||||||||||||
2002 - 2018 National Fire Incident Reporting System (NFIRS) incidents
- Incident types reported to NFIRS in Roeland Park, KS
- 1,59652.3%Rescue & EMS
- 46215.1%Good Intent Call
- 41513.6%Hazardous Condition
- 2126.9%Service Call
- 2006.6%Fire
- 1464.8%False Alarm
- 120.4%Overpressure Rupture
- 50.2%Special Incident
- Fire incident types reported to NFIRS in Roeland Park, KS
- 8743.5%Structure Fires
- 6532.5%Outside Fires
- 4321.5%Mobile Property/Vehicle Fires
- 52.5%Other
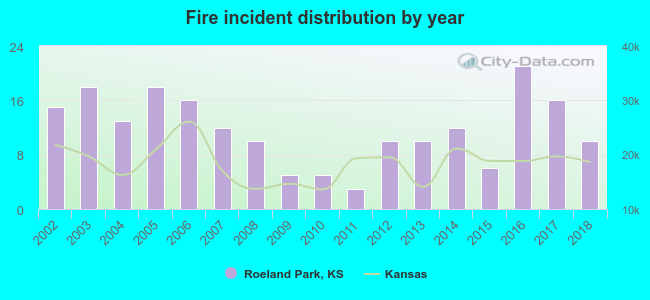 Based on the data from the years 2002 - 2018 the average number of fire incidents per year is 12. The highest number of fire incidents - 21 took place in 2016, and the least - 3 in 2011. The data has a decreasing trend.
The average number of yearly fire incidents per 10k residents in Roeland Park, KS compared to nearest cities:
(Note: Based on data for the last 3 years, including only cities with population 5,000 and above)
| Roeland Park: | 22.9 |
| Mission: | 28.1 |
| Merriam: | 38.7 |
| Prairie Village: | 14.3 |
| Kansas City: | 42.0 |
| Overland Park: | 21.0 |
| Shawnee: | 23.6 |
| Leawood: | 17.8 |
| Lenexa: | 30.4 |
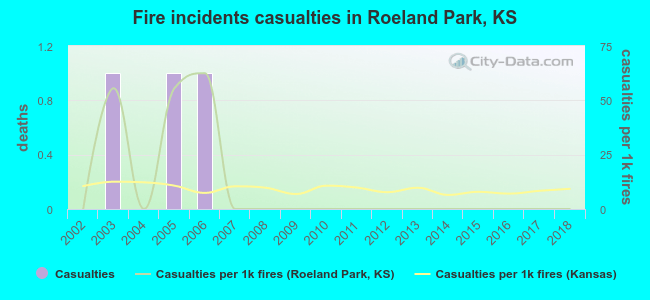 Based on the reports from the years 2002 - 2018 the average number of fire-related casualties per year is 0. The highest number of injuries - 1 took place in 2003, and the lowest - 0 in 2002. The data has a constant trend.
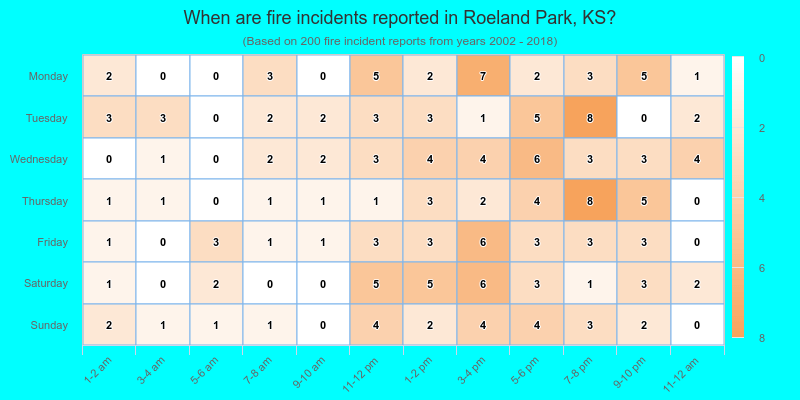
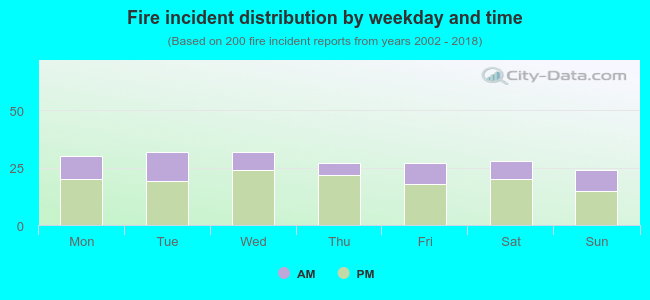 31.0% incidents where reported in the morning and 69.0% in the evening. The most fires (16.0%) took place on Tuesday, and the least (12.0%) on Sunday.
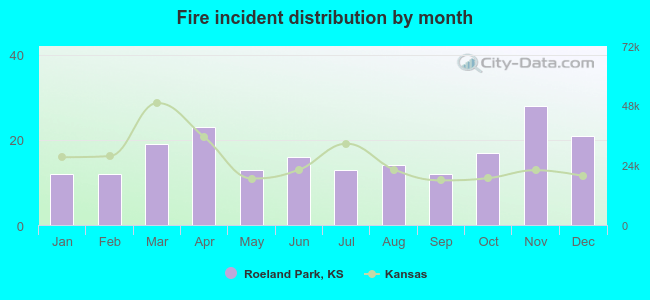 According to the 200 incident reports from years 2002 - 2018 most fires (14.0%) took place during November, and the least (6.0%) in January.
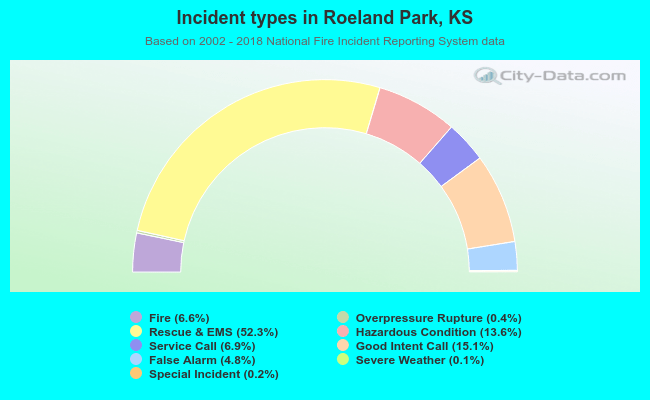 Out of all 3,051 cases reported during the years 2002 - 2018, the most belonged to the categories: Rescue & EMS (52.3%), Good Intent Call (15.1%), and Hazardous Condition (13.6%).
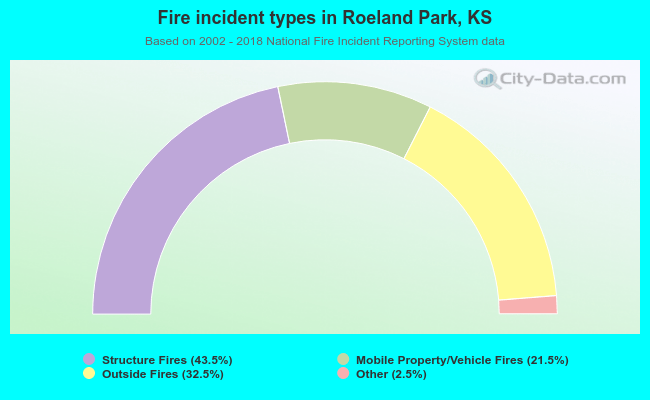 When looking into fire subcategories, the most incidents belonged to: Structure Fires (43.5%), and Outside Fires (32.5%).