Palmerton: Fire Incidents, Pennsylvania (PA)
Where are fire incidents reported in Palmerton, PA
Something went wrong! Please refresh the page.
|
| |||||||||||||||||||||||||||||||||||||||||||||||||||||||||||||||||||||||||||||||||||||||||||||||||||||||||||||
2003 - 2018 National Fire Incident Reporting System (NFIRS) incidents
- Incident types reported to NFIRS in Palmerton, PA
- 19839.0%Fire
- 12424.4%Rescue & EMS
- 6212.2%Good Intent Call
- 5711.2%False Alarm
- 336.5%Hazardous Condition
- 316.1%Service Call
- 20.4%Overpressure Rupture
- 10.2%Severe Weather
- Fire incident types reported to NFIRS in Palmerton, PA
- 11457.6%Structure Fires
- 5226.3%Outside Fires
- 189.1%Mobile Property/Vehicle Fires
- 147.1%Other
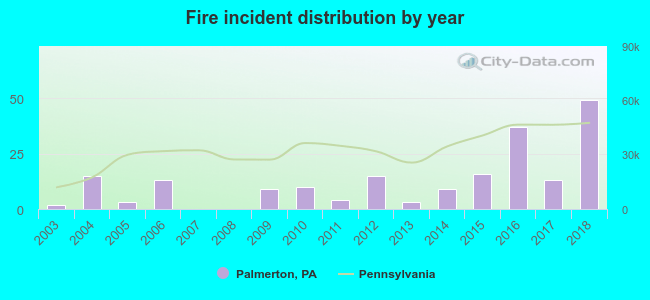 According to the data from the years 2003 - 2018 the average number of fire incidents per year is 12. The highest number of reported fire incidents - 49 took place in 2018, and the least - 0 in 2007. The data has a growing trend.
The average number of yearly fire incidents per 10k residents in Palmerton, PA compared to nearest cities:
(Note: Based on data for the last 3 years, including only cities with population 5,000 and above)
| Palmerton: | 61.7 |
| Lehighton: | 54.1 |
| Northampton: | 71.3 |
| Catasauqua: | 59.4 |
| Allentown: | 11.6 |
| Nazareth: | 52.5 |
| Wescosville: | 18.2 |
| Bethlehem: | 29.6 |
| Tamaqua: | 104.4 |

 26.3% incidents where reported in the morning and 73.7% in the evening. The most fires (17.2%) took place on Monday, and the least (8.1%) on Saturday.
 According to the 198 fire incident reports from years 2003 - 2018 most fires (11.1%) took place during January, and the least (4.0%) in August.
 Out of all 508 cases reported during the years 2003 - 2018, the most belonged to the categories: Fire (39.0%), Rescue & EMS (24.4%), and Good Intent Call (12.2%).
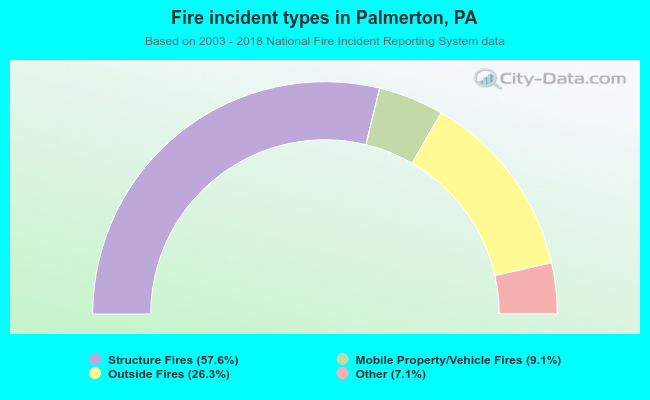 When looking into fire subcategories, the most reports belonged to: Structure Fires (57.6%), and Outside Fires (26.3%).