Patterson: Fire Incidents, New York (NY)
Where are fire incidents reported in Patterson, NY
Something went wrong! Please refresh the page.
| Fire incidents reported | |
|---|---|
| Sreet name | Count |
| ROUTE 22 | 86 |
| ROUTE 311 | 86 |
| RT 22 | 36 |
| FAIR ST | 34 |
| ROUTE 292 | 30 |
| BULLET HOLE RD | 24 |
| FARM TO MARKET RD | 24 |
| RT 311 | 24 |
| SOUTH STREET | 20 |
| SOMERSET DRIVE | 18 |
| BRIMSTONE RD | 16 |
| FRONT STREET | 16 |
| MOONEY HILL RD | 16 |
| CORNWALL HILL RD | 14 |
| BIG ELM ROAD | 12 |
| DOANSBURG RD | 12 |
| FAIR STREET | 12 |
| FOX RUN LANE | 12 |
| HAVILAND DRIVE | 12 |
| HAVILAND HOLLOW RD | 12 |
| INTERSTATE 84 EAST BOUND | 12 |
| LAKE SHORE DR | 12 |
| PATTERSON VILLAGE CT | 12 |
| ROUTE 164 | 12 |
| BIRCH HILL RD | 10 |
| CORNWALL HILL ROAD | 10 |
| CUSHMAN RD | 10 |
| CUSHMAN ROAD | 10 |
| EAST BRANCH RD | 10 |
| FAIRFIELD DR | 10 |
| Other | 280 |
2002 - 2018 National Fire Incident Reporting System (NFIRS) incidents
- Incident types reported to NFIRS in Patterson, NY
- 1,97331.9%Rescue & EMS
- 1,60926.0%Good Intent Call
- 94015.2%Hazardous Condition
- 90414.6%Fire
- 5018.1%False Alarm
- 2073.3%Service Call
- 230.4%Severe Weather
- 140.2%Special Incident
- 100.2%Overpressure Rupture
- Fire incident types reported to NFIRS in Patterson, NY
- 51156.5%Structure Fires
- 25928.7%Outside Fires
- 10811.9%Mobile Property/Vehicle Fires
- 262.9%Other
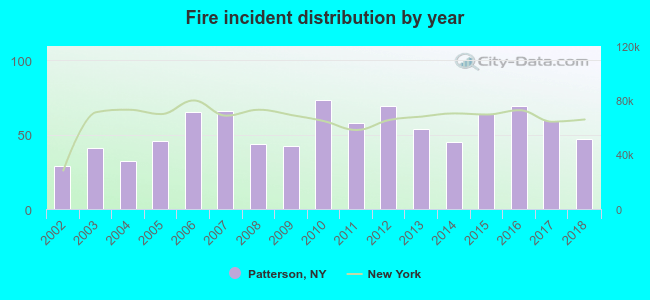 Based on the data from the years 2002 - 2018 the average number of fires per year is 53. The highest number of reported fire incidents - 73 took place in 2010, and the least - 29 in 2002. The data has a rising trend.
The average number of yearly fire incidents per 10k residents in Patterson, NY compared to nearest cities:
(Note: Based on data for the last 3 years, including only cities with population 5,000 and above)
| Patterson: | 48.8 |
| Lake Carmel: | 4.8 |
| Southeast: | 3.3 |
| Kent: | 14.3 |
| Carmel: | 19.4 |
| North Salem: | 58.8 |
| Mahopac: | 131.4 |
| Beekman: | 5.2 |
| East Fishkill: | 0.9 |
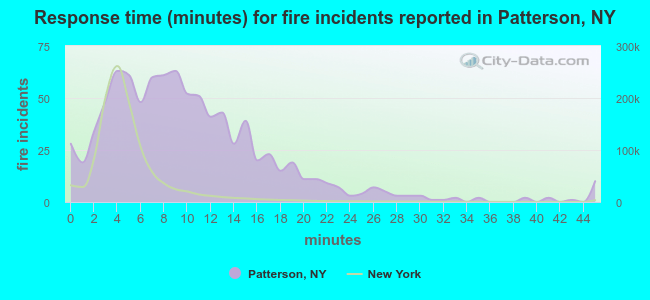 The median response time based on all reported fire incidents is 9 minutes. This is much higher compared to the state median value.
The median response time in Patterson, NY compared to nearest cities:
(Note: Based on data for all years, including only cities with at least 500 fire incidents)
| Patterson: | 9 minutes |
| New Fairfield: | 7 minutes |
| Brewster: | 8 minutes |
| Danbury: | 5 minutes |
| Brookfield: | 6 minutes |
| Carmel: | 8 minutes |
| Bethel: | 6 minutes |
| Mahopac: | 7 minutes |
| New Milford: | 7 minutes |
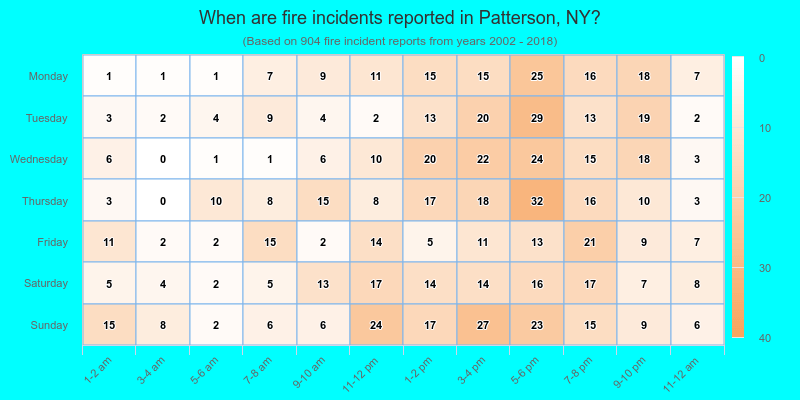
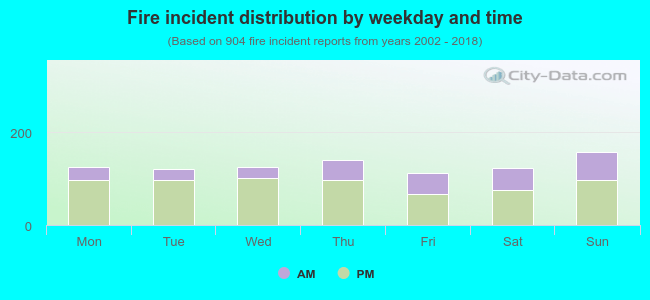 30.4% incidents where reported in the morning and 69.6% in the evening. The most fires (17.5%) took place on Sunday, and the least (12.4%) on Friday.
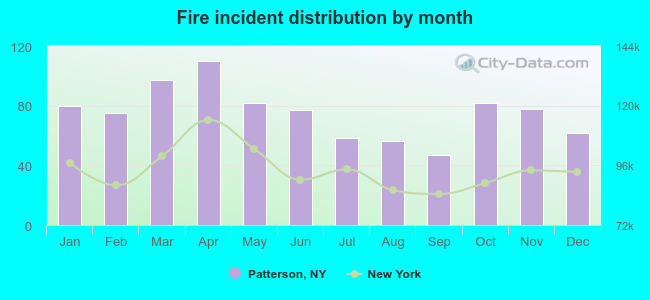 According to the 904 fire incidents from years 2002 - 2018 most fires (12.2%) took place during April, and the least (5.2%) in September.
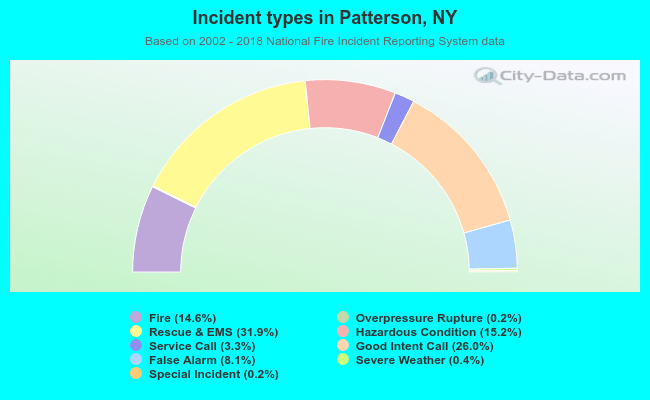 Out of all 6,181 cases reported during the years 2002 - 2018, the most belonged to the categories: Rescue & EMS (31.9%), Good Intent Call (26.0%), and Hazardous Condition (15.2%).
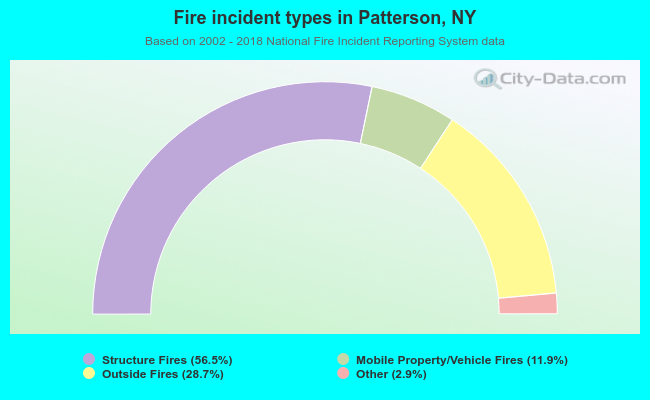 When looking into fire subcategories, the most reports belonged to: Structure Fires (56.5%), and Outside Fires (28.7%).