Petersburg: Fire Incidents, Virginia (VA)
Where are fire incidents reported in Petersburg, VA
Something went wrong! Please refresh the page.
| Fire incidents reported | |
|---|---|
| Sreet name | Count |
| CRATER RD | 294 |
| BOYDTON PLANK RD | 252 |
| WASHINGTON ST | 216 |
| RIVER RD | 150 |
| JOHNSON RD | 100 |
| COX RD | 98 |
| SYCAMORE ST | 98 |
| COUNTY DR | 90 |
| DUNCAN RD | 68 |
| DUPUY RD | 62 |
| WYTHE ST | 60 |
| CHURCH RD | 56 |
| FARMER ST | 50 |
| HICKORY RD | 50 |
| HALIFAX ST | 46 |
| HARDING ST | 44 |
| SQUIRREL LEVEL RD | 44 |
| UNION BRANCH RD | 40 |
| FERNDALE AVE | 38 |
| I95 | 38 |
| WOODPECKER RD | 38 |
| WEST ST | 36 |
| SOUTH CRATER RD | 34 |
| FERNDALE RD | 32 |
| FILLMORE ST | 32 |
| HALIFAX RD | 32 |
| HINTON ST | 32 |
| JEFFERSON ST | 32 |
| FRONTAGE RD | 30 |
| ROME ST | 30 |
| Other | 1,310 |
2002 - 2018 National Fire Incident Reporting System (NFIRS) incidents
- Incident types reported to NFIRS in Petersburg, VA
- 10,65743.7%Rescue & EMS
- 4,19517.2%Hazardous Condition
- 3,53214.5%Fire
- 2,3239.5%Good Intent Call
- 1,8317.5%Service Call
- 1,7687.3%False Alarm
- 440.2%Overpressure Rupture
- Fire incident types reported to NFIRS in Petersburg, VA
- 1,53243.4%Structure Fires
- 1,23535.0%Outside Fires
- 67719.2%Mobile Property/Vehicle Fires
- 882.5%Other
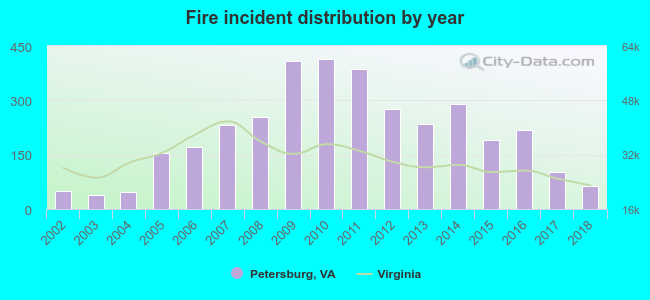 According to the data from the years 2002 - 2018 the average number of fires per year is 208. The highest number of reported fire incidents - 413 took place in 2010, and the least - 40 in 2003. The data has a rising trend.
The average number of yearly fire incidents per 10k residents in Petersburg, VA compared to nearest cities:
(Note: Based on data for the last 3 years, including only cities with population 5,000 and above)
| Petersburg: | 39.0 |
| Ettrick: | 11.2 |
| Colonial Heights: | 44.9 |
| Hopewell: | 38.1 |
| Chester: | 80.8 |
| Bellwood: | 45.7 |
| Bensley: | 56.7 |
| Sandston: | 66.5 |
| Richmond: | 66.9 |
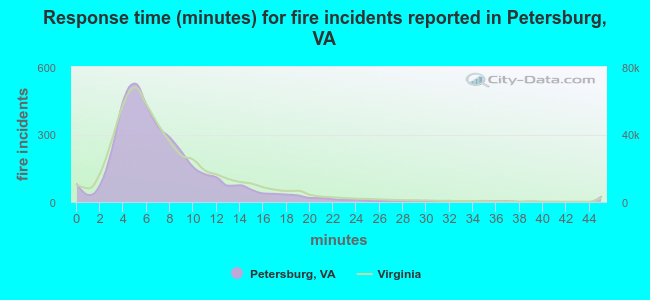 The median response time based on all reported fire incidents is 6 minutes. This is comparable to the state median value.
The median response time in Petersburg, VA compared to nearest cities:
(Note: Based on data for all years, including only cities with at least 500 fire incidents)
| Petersburg: | 6 minutes |
| Colonial Heights: | 6 minutes |
| Prince George: | 8 minutes |
| Hopewell: | 5 minutes |
| Chester: | 6 minutes |
| Charles City: | 16 minutes |
| Waverly: | 9 minutes |
| Sandston: | 6 minutes |
| Richmond: | 5 minutes |
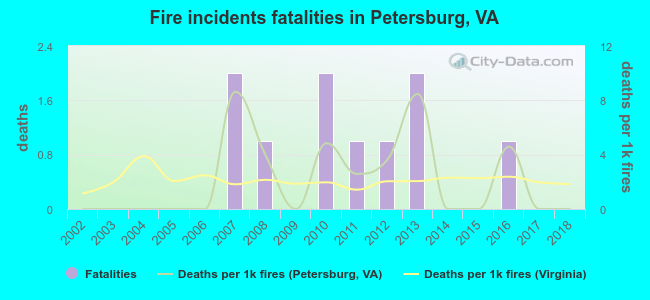 Based on the reports from the years 2002 - 2018 the average number of fire-related yearly deaths is 1. The highest number of deaths - 2 took place in 2007, and the lowest - 0 in 2002. The data has a constant trend.
The average number of deaths per 1,000 fires is 2. This indicator was the highest - 9 in 2007, and the lowest 0 in 2002. The trend for deaths per 1,000 incidents is declining. Compared to the state value the number of deaths per 1,000 fires is higher.
Based on the reports from the years 2002 - 2018 the average number of fire-related yearly deaths is 1. The highest number of deaths - 2 took place in 2007, and the lowest - 0 in 2002. The data has a constant trend.
The average number of deaths per 1,000 fires is 2. This indicator was the highest - 9 in 2007, and the lowest 0 in 2002. The trend for deaths per 1,000 incidents is declining. Compared to the state value the number of deaths per 1,000 fires is higher.Deaths per 1,000 incidents in Petersburg, VA compared to nearest cities:
(Note: Based on data for all years, including only cities with at least 2,500 fire incidents)
| Petersburg: | 2.8 |
| Chester: | 3.2 |
| Richmond: | 2.2 |
| Mechanicsville: | 0.8 |
| Williamsburg: | 2.2 |
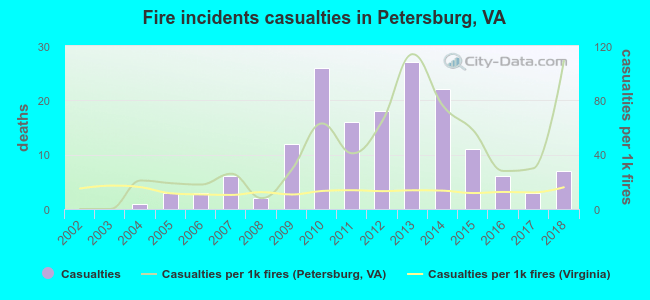 According to the data from the years 2002 - 2018 the average number of fire-related yearly casualties is 10. The highest number of reported injuries - 27 took place in 2013, and the lowest - 0 in 2002. The data has an increasing trend.
The average number of casualties per 1,000 fires is 41. This indicator was the highest - 114 in 2013, and the lowest 0 in 2002. The trend for casualties per 1,000 incidents is growing. Compared to the Virginia value the number of injuries per 1,000 fires is much higher.
According to the data from the years 2002 - 2018 the average number of fire-related yearly casualties is 10. The highest number of reported injuries - 27 took place in 2013, and the lowest - 0 in 2002. The data has an increasing trend.
The average number of casualties per 1,000 fires is 41. This indicator was the highest - 114 in 2013, and the lowest 0 in 2002. The trend for casualties per 1,000 incidents is growing. Compared to the Virginia value the number of injuries per 1,000 fires is much higher.Casualties per 1,000 incidents in Petersburg, VA compared to nearest cities:
(Note: Based on data for all years, including only cities with at least 500 fire incidents)
| Petersburg: | 46.1 |
| Colonial Heights: | 45.2 |
| Prince George: | 3.7 |
| Hopewell: | 36.9 |
| Chester: | 40.8 |
| Charles City: | 0.0 |
| Waverly: | 0.0 |
| Sandston: | 18.9 |
| Richmond: | 26.0 |
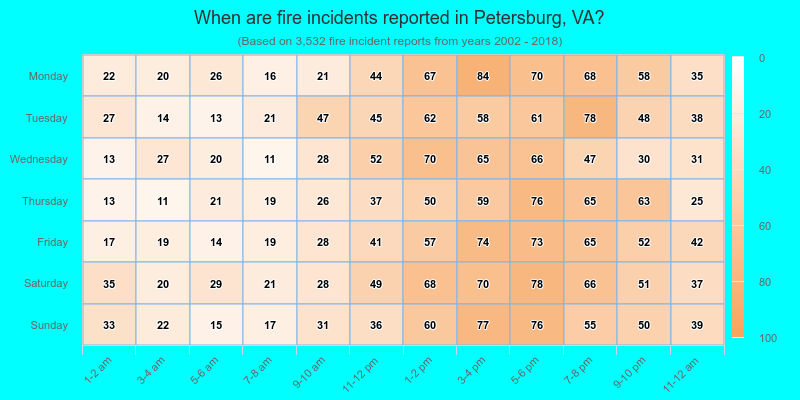
 30.2% incidents where reported in the morning and 69.8% in the evening. The most fires (15.6%) took place on Saturday, and the least (13.0%) on Wednesday.
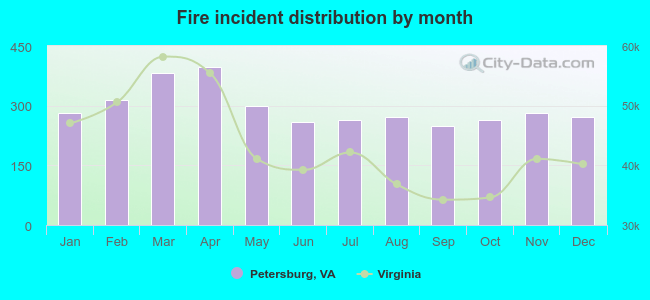 According to the 3,532 fires from years 2002 - 2018 most fires (11.3%) took place during April, and the least (7.0%) in September.
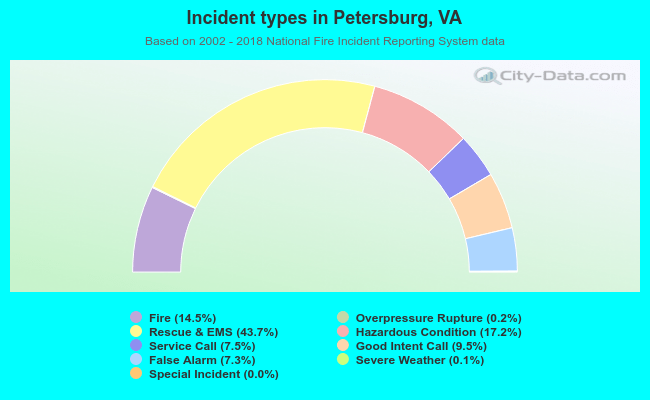 Out of all 24,382 cases reported during the years 2002 - 2018, the most belonged to the categories: Rescue & EMS (43.7%), Hazardous Condition (17.2%), and Fire (14.5%).
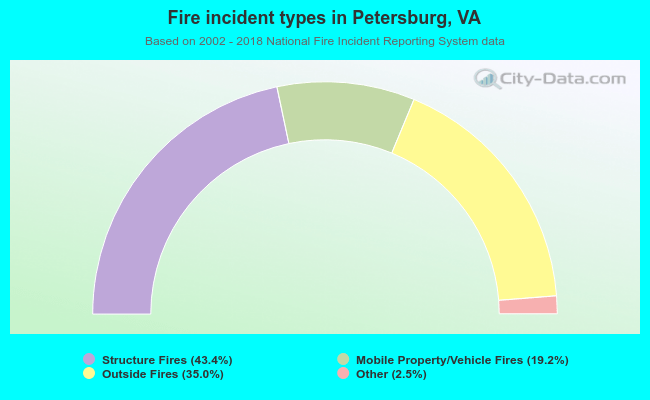 When looking into fire subcategories, the most incidents belonged to: Structure Fires (43.4%), and Outside Fires (35.0%).