Williamsburg: Fire Incidents, Virginia (VA)
Where are fire incidents reported in Williamsburg, VA
Something went wrong! Please refresh the page.
| Fire incidents reported | |
|---|---|
| Sreet name | Count |
| RICHMOND RD | 792 |
| POCAHONTAS TRL | 676 |
| MERRIMAC TRL | 646 |
| INTERSTATE 64 | 330 |
| MOORETOWN RD | 254 |
| ROCHAMBEAU DR | 192 |
| MONTICELLO AVE | 184 |
| I 64 | 174 |
| JAMESTOWN RD | 154 |
| JOHN TYLER HWY | 150 |
| IRONBOUND RD | 136 |
| CENTERVILLE RD | 120 |
| I 64 E | 116 |
| BYPASS RD | 98 |
| CAPITOL LANDING RD | 90 |
| LONGHILL RD | 88 |
| YORK ST | 76 |
| HENRY ST | 66 |
| PENNIMAN RD | 58 |
| DUKE OF GLOUCESTER ST | 56 |
| FRANCIS ST | 52 |
| JOLLY POND RD | 52 |
| WATER COUNTRY PKY | 52 |
| CROAKER RD | 50 |
| MCLAWS CIR | 50 |
| POCAHANTAS TRL | 50 |
| AIRPORT RD | 48 |
| GRAND STRAND DR | 46 |
| OLDE TOWNE RD | 46 |
| SCOTLAND ST | 42 |
| Other | 933 |
2002 - 2018 National Fire Incident Reporting System (NFIRS) incidents
- Incident types reported to NFIRS in Williamsburg, VA
- 53,74957.4%Rescue & EMS
- 8,4679.0%False Alarm
- 8,1738.7%Good Intent Call
- 7,6188.1%Hazardous Condition
- 6,7327.2%Service Call
- 5,8776.3%Fire
- 2,5612.7%Special Incident
- 2980.3%Severe Weather
- 1180.1%Overpressure Rupture
- Fire incident types reported to NFIRS in Williamsburg, VA
- 2,77247.2%Structure Fires
- 1,93933.0%Outside Fires
- 1,01317.2%Mobile Property/Vehicle Fires
- 1532.6%Other
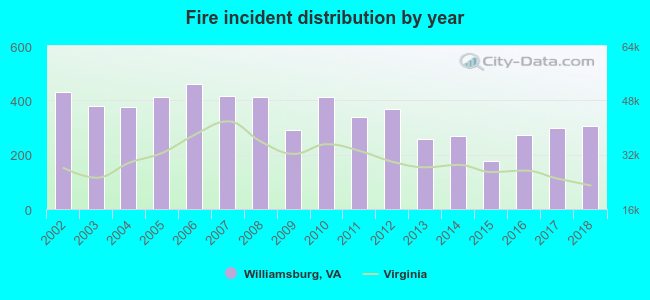 Based on the data from the years 2002 - 2018 the average number of fire incidents per year is 346. The highest number of fires - 461 took place in 2006, and the least - 178 in 2015. The data has a decreasing trend.
The average number of yearly fire incidents per 10k residents in Williamsburg, VA compared to nearest cities:
(Note: Based on data for the last 3 years, including only cities with population 5,000 and above)
| Williamsburg: | 198.5 |
| Newport News: | 28.0 |
| Poquoson: | 23.2 |
| Smithfield: | 57.1 |
| Hampton: | 28.4 |
| Hopewell: | 38.1 |
| Meadowbrook: | 8.5 |
| Norfolk: | 30.1 |
| Portsmouth: | 39.2 |
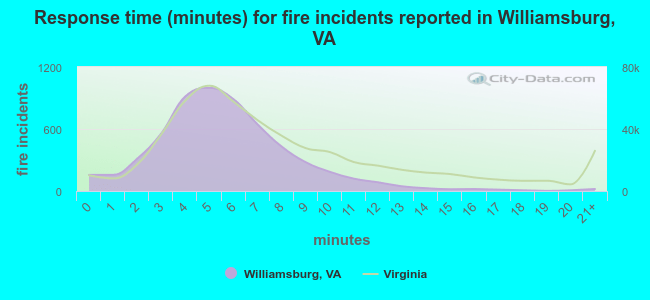 The median response time based on all reported fire incidents is 5 minutes. This is lower compared to the Virginia median value.
The median response time in Williamsburg, VA compared to nearest cities:
(Note: Based on data for all years, including only cities with at least 500 fire incidents)
| Williamsburg: | 5 minutes |
| Concord: | 10 minutes |
| Yorktown: | 5 minutes |
| Newport News: | 5 minutes |
| Charles City: | 16 minutes |
| Poquoson: | 4 minutes |
| Smithfield: | 7 minutes |
| Hampton: | 5 minutes |
| Waverly: | 9 minutes |
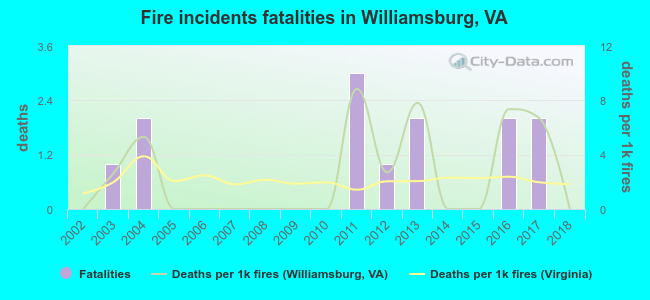 Based on the reports from the years 2002 - 2018 the average number of fire-related fatalities per year is 1. The highest number of reported deaths - 3 took place in 2011, and the lowest - 0 in 2002. The data has a constant trend.
The average number of deaths per 1,000 fires is 2. This indicator was the highest - 9 in 2011, and the lowest 0 in 2002. The trend for deaths per 1,000 fire incidents is constant. Compared to the Virginia value the number of fatalities per 1,000 fires is about the same.
Based on the reports from the years 2002 - 2018 the average number of fire-related fatalities per year is 1. The highest number of reported deaths - 3 took place in 2011, and the lowest - 0 in 2002. The data has a constant trend.
The average number of deaths per 1,000 fires is 2. This indicator was the highest - 9 in 2011, and the lowest 0 in 2002. The trend for deaths per 1,000 fire incidents is constant. Compared to the Virginia value the number of fatalities per 1,000 fires is about the same.Deaths per 1,000 incidents in Williamsburg, VA compared to nearest cities:
(Note: Based on data for all years, including only cities with at least 2,500 fire incidents)
| Williamsburg: | 2.2 |
| Newport News: | 2.1 |
| Hampton: | 2.5 |
| Norfolk: | 1.0 |
| Portsmouth: | 2.1 |
| Suffolk: | 1.7 |
| Petersburg: | 2.8 |
| Chester: | 3.2 |
| Chesapeake: | 2.6 |
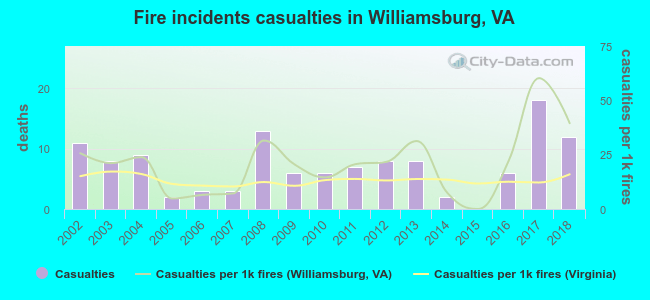 According to the reports from the years 2002 - 2018 the average number of fire-related casualties per year is 7. The highest number of reported injuries - 18 took place in 2017, and the lowest - 0 in 2015. The data has an increasing trend.
The average number of injuries per 1,000 fire incidents is 21. This indicator was the highest - 60 in 2017, and the lowest 0 in 2015. The trend for injuries per 1,000 fires is rising. Compared to the state value the number of casualties per 1,000 incidents is higher.
According to the reports from the years 2002 - 2018 the average number of fire-related casualties per year is 7. The highest number of reported injuries - 18 took place in 2017, and the lowest - 0 in 2015. The data has an increasing trend.
The average number of injuries per 1,000 fire incidents is 21. This indicator was the highest - 60 in 2017, and the lowest 0 in 2015. The trend for injuries per 1,000 fires is rising. Compared to the state value the number of casualties per 1,000 incidents is higher.Casualties per 1,000 incidents in Williamsburg, VA compared to nearest cities:
(Note: Based on data for all years, including only cities with at least 500 fire incidents)
| Williamsburg: | 20.8 |
| Concord: | 0.0 |
| Yorktown: | 22.7 |
| Newport News: | 39.0 |
| Charles City: | 0.0 |
| Poquoson: | 17.4 |
| Smithfield: | 4.9 |
| Hampton: | 19.6 |
| Waverly: | 0.0 |
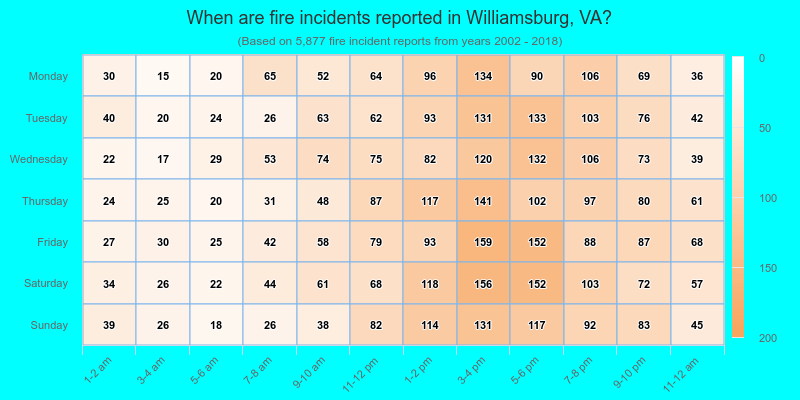
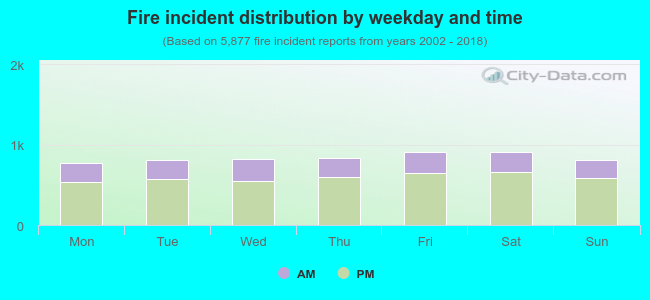 29.5% incidents where reported in the morning and 70.5% in the evening. The most fires (15.5%) took place on Saturday, and the least (13.2%) on Monday.
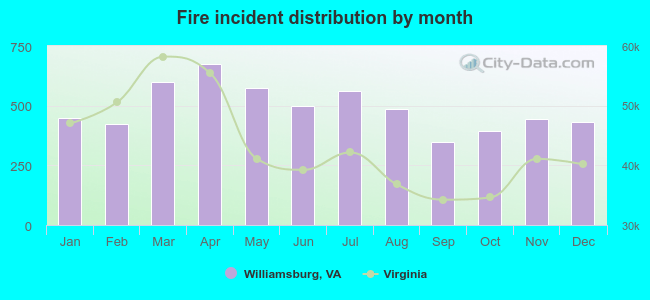 According to the 5,877 reports from years 2002 - 2018 most fires (11.5%) took place during April, and the least (5.9%) in September.
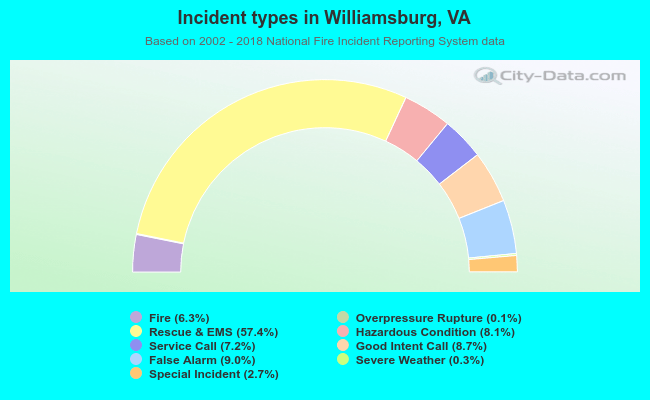 Out of all 93,593 cases reported during the years 2002 - 2018, the most belonged to the categories: Rescue & EMS (57.4%), False Alarm (9.0%), and Good Intent Call (8.7%).
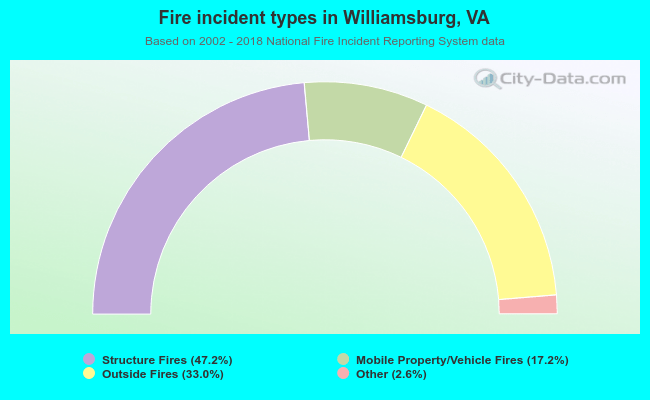 When looking into fire subcategories, the most incidents belonged to: Structure Fires (47.2%), and Outside Fires (33.0%).