Wanaque: Fire Incidents, New Jersey (NJ)
Where are fire incidents reported in Wanaque, NJ
Something went wrong! Please refresh the page.
|
| |||||||||||||||||||||||||||||||||||||||||||||||||||||||||||||||||||||||||||||||||||||||||||||||||||||||||||||
2003 - 2018 National Fire Incident Reporting System (NFIRS) incidents
- Incident types reported to NFIRS in Wanaque, NJ
- 22633.6%Fire
- 21231.5%Hazardous Condition
- 17025.3%False Alarm
- 233.4%Rescue & EMS
- 223.3%Service Call
- 152.2%Good Intent Call
- 20.3%Overpressure Rupture
- 20.3%Special Incident
- Fire incident types reported to NFIRS in Wanaque, NJ
- 15367.7%Structure Fires
- 4519.9%Outside Fires
- 219.3%Mobile Property/Vehicle Fires
- 73.1%Other
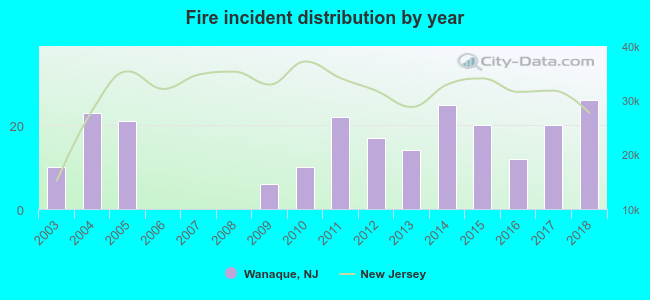 According to the data from the years 2003 - 2018 the average number of fires per year is 14. The highest number of reported fire incidents - 26 took place in 2018, and the least - 0 in 2006. The data has a growing trend.
The average number of yearly fire incidents per 10k residents in Wanaque, NJ compared to nearest cities:
(Note: Based on data for the last 3 years, including only cities with population 5,000 and above)
| Wanaque: | 16.9 |
| Pompton Lakes: | 14.9 |
| Bloomingdale: | 25.3 |
| Oakland: | 19.9 |
| Butler: | 16.5 |
| Ringwood: | 59.8 |
| Franklin Lakes: | 20.3 |
| Kinnelon: | 32.8 |
| Wyckoff: | 51.7 |
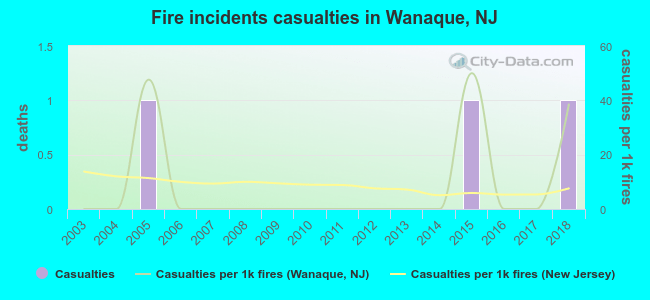 Based on the data from the years 2003 - 2018 the average number of fire-related yearly casualties is 0. The highest number of reported casualties - 1 took place in 2005, and the lowest - 0 in 2003. The data has an increasing trend.
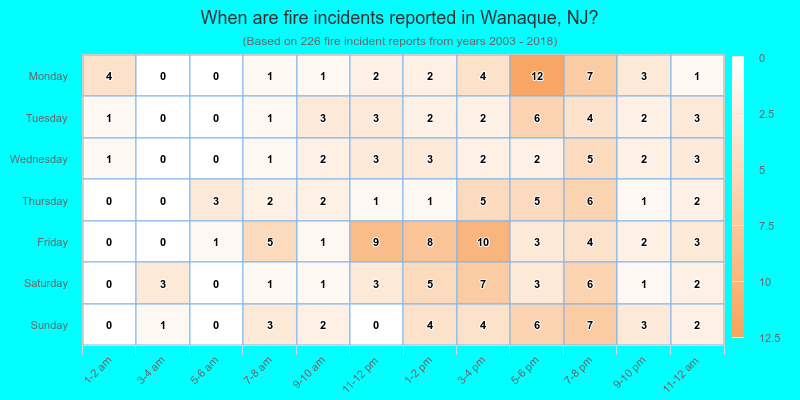
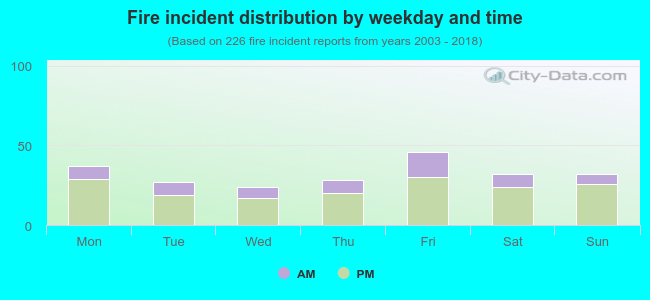 27.0% incidents where reported in the morning and 73.0% in the evening. The most fires (20.4%) took place on Friday, and the least (10.6%) on Wednesday.
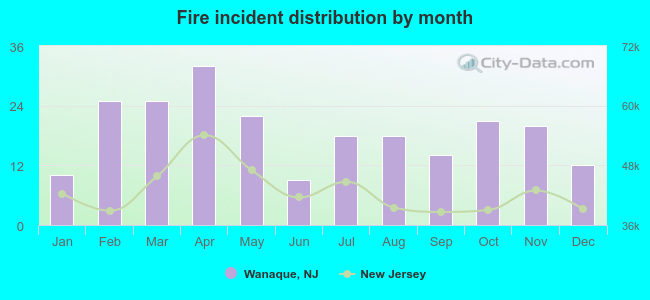 According to the 226 fires from years 2003 - 2018 most fires (14.2%) took place during April, and the least (4.0%) in June.
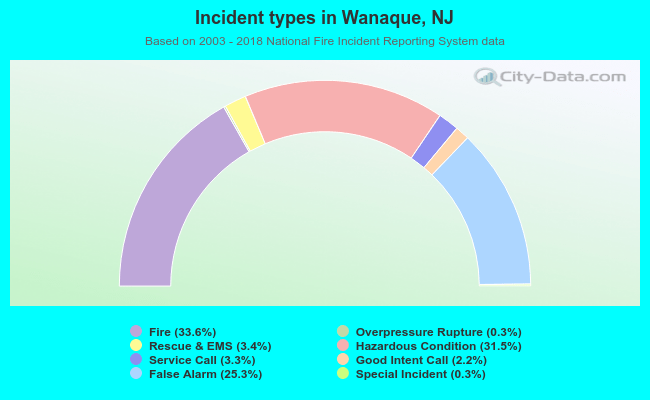 Out of all 672 cases reported during the years 2003 - 2018, the most belonged to the categories: Fire (33.6%), Hazardous Condition (31.5%), and False Alarm (25.3%).
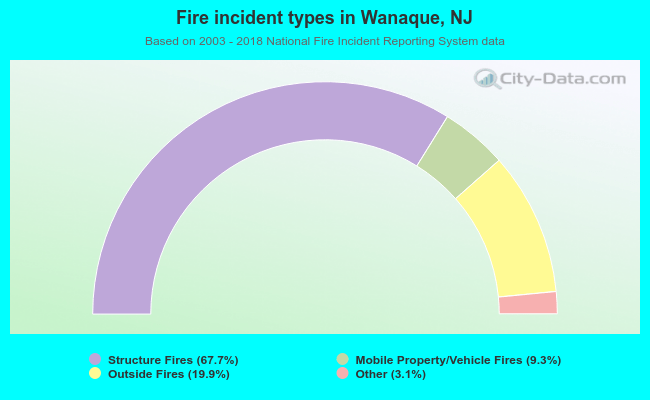 When looking into fire subcategories, the most reports belonged to: Structure Fires (67.7%), and Outside Fires (19.9%).