Pontoon Beach: Fire Incidents, Illinois (IL)
Where are fire incidents reported in Pontoon Beach, IL
Something went wrong! Please refresh the page.
|
| |||||||||||||||||||||||||||||||||||||||||||||||||||||||||||||||||||||||||||||||||||||||||||||||||||||||||||||
2002 - 2018 National Fire Incident Reporting System (NFIRS) incidents
- Incident types reported to NFIRS in Pontoon Beach, IL
- 1,59346.4%Rescue & EMS
- 91126.5%Fire
- 45913.4%Hazardous Condition
- 1815.3%False Alarm
- 1504.4%Good Intent Call
- 1213.5%Service Call
- 100.3%Severe Weather
- 50.1%Special Incident
- Fire incident types reported to NFIRS in Pontoon Beach, IL
- 46450.9%Structure Fires
- 24326.7%Outside Fires
- 12213.4%Mobile Property/Vehicle Fires
- 829.0%Other
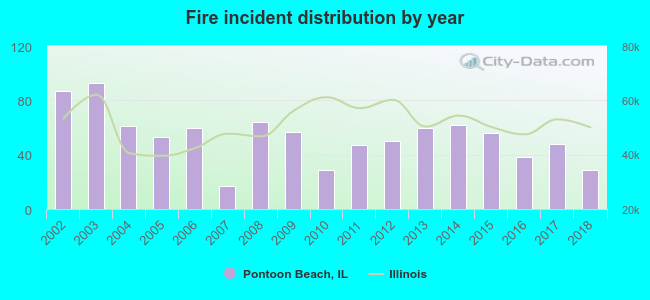 According to the data from the years 2002 - 2018 the average number of fires per year is 54. The highest number of reported fire incidents - 93 took place in 2003, and the least - 17 in 2007. The data has a dropping trend.
The average number of yearly fire incidents per 10k residents in Pontoon Beach, IL compared to nearest cities:
(Note: Based on data for the last 3 years, including only cities with population 5,000 and above)
| Pontoon Beach: | 67.6 |
| Granite City: | 49.8 |
| Collinsville: | 53.9 |
| Glen Carbon: | 17.8 |
| Maryville: | 3.8 |
| Edwardsville: | 34.3 |
| Troy: | 44.4 |
| Wood River: | 55.0 |
| Fairview Heights: | 48.7 |
 The median response time based on all reported fire incidents is 7 minutes. This is higher compared to the Illinois median value.
The median response time in Pontoon Beach, IL compared to nearest cities:
(Note: Based on data for all years, including only cities with at least 500 fire incidents)
| Pontoon Beach: | 7 minutes |
| Granite City: | 3 minutes |
| Collinsville: | 5 minutes |
| Madison: | 6 minutes |
| Caseyville: | 6 minutes |
| Washington Park: | 5 minutes |
| Edwardsville: | 7 minutes |
| East St. Louis: | 6 minutes |
| Troy: | 8 minutes |
 33.7% incidents where reported in the morning and 66.3% in the evening. The most fires (15.7%) took place on Tuesday, and the least (12.5%) on Wednesday.
 Based on the 911 fire incidents from years 2002 - 2018 most fires (11.2%) took place during July, and the least (6.0%) in December.
 Out of all 3,432 cases reported during the years 2002 - 2018, the most belonged to the categories: Rescue & EMS (46.4%), Fire (26.5%), and Hazardous Condition (13.4%).
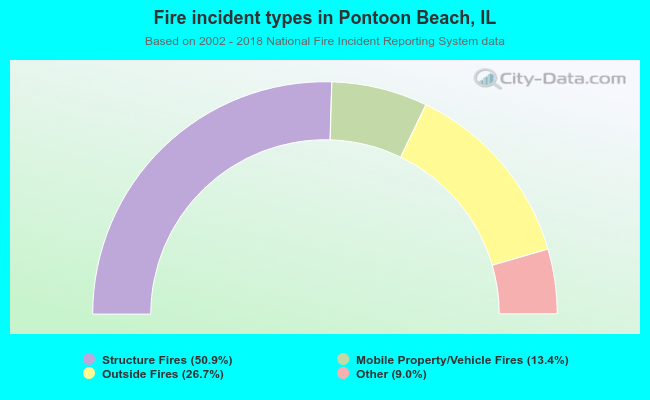 When looking into fire subcategories, the most incidents belonged to: Structure Fires (50.9%), and Outside Fires (26.7%).