Collinsville: Fire Incidents, Illinois (IL)
Where are fire incidents reported in Collinsville, IL
Something went wrong! Please refresh the page.
| Fire incidents reported | |
|---|---|
| Sreet name | Count |
| BLUFF RD | 128 |
| MAIN ST | 112 |
| VANDALIA ST | 108 |
| BELT LINE RD | 104 |
| COLLINSVILLE RD | 94 |
| I-55/70 | 82 |
| MORRISON | 64 |
| I5570 | 56 |
| ST. LOUIS RD | 56 |
| I-255 | 54 |
| BURLINGTON ST | 50 |
| ART ST | 48 |
| AURORA ST | 48 |
| CLAY ST | 48 |
| MORRISON AVE | 48 |
| LEBANON RD | 44 |
| ARLINGTON | 42 |
| IDLEBROOK DR | 42 |
| PINE LAKE RD | 40 |
| KEEBLER RD | 38 |
| CLINTON | 36 |
| ART | 34 |
| BELLEVUE DR | 34 |
| JOHN | 34 |
| MULBERRY ST | 34 |
| CHEROKEE DR | 32 |
| JOHN ST | 32 |
| COLLINSVILLE CROSSING BLVD | 30 |
| EASTPORT PLAZA DR | 30 |
| ST LOUIS RD | 30 |
| Other | 856 |
2002 - 2018 National Fire Incident Reporting System (NFIRS) incidents
- Incident types reported to NFIRS in Collinsville, IL
- 7,31749.6%Rescue & EMS
- 2,48816.9%Fire
- 1,79312.1%Hazardous Condition
- 1,2558.5%Service Call
- 9856.7%False Alarm
- 9036.1%Good Intent Call
- Fire incident types reported to NFIRS in Collinsville, IL
- 1,04942.2%Structure Fires
- 88635.6%Outside Fires
- 50120.1%Mobile Property/Vehicle Fires
- 522.1%Other
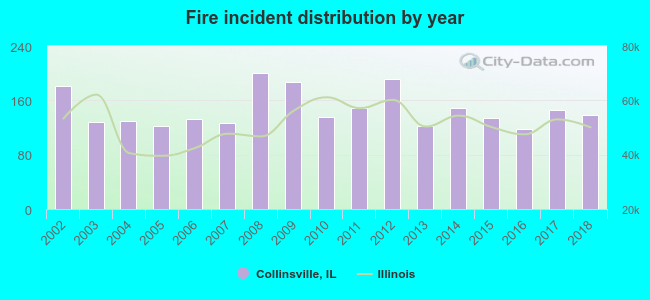 Based on the data from the years 2002 - 2018 the average number of fires per year is 146. The highest number of fire incidents - 200 took place in 2008, and the least - 118 in 2016. The data has a dropping trend.
The average number of yearly fire incidents per 10k residents in Collinsville, IL compared to nearest cities:
(Note: Based on data for the last 3 years, including only cities with population 5,000 and above)
| Collinsville: | 53.9 |
| Maryville: | 3.8 |
| Pontoon Beach: | 67.6 |
| Fairview Heights: | 48.7 |
| Glen Carbon: | 17.8 |
| Troy: | 44.4 |
| Granite City: | 49.8 |
| Centreville: | 233.1 |
| Swansea: | 29.8 |
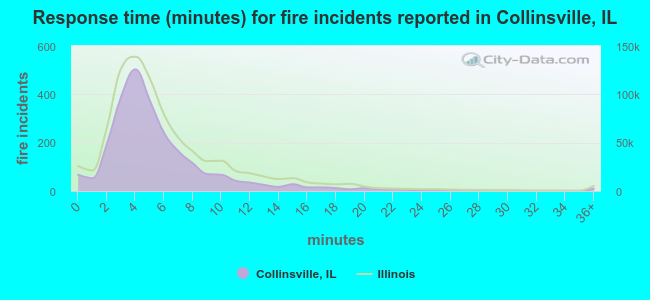 The median response time based on all reported fire incidents is 5 minutes. This is close to the Illinois median value.
The median response time in Collinsville, IL compared to nearest cities:
(Note: Based on data for all years, including only cities with at least 500 fire incidents)
| Collinsville: | 5 minutes |
| Caseyville: | 6 minutes |
| Pontoon Beach: | 7 minutes |
| Fairview Heights: | 5 minutes |
| Washington Park: | 5 minutes |
| Troy: | 8 minutes |
| Granite City: | 3 minutes |
| East St. Louis: | 6 minutes |
| Madison: | 6 minutes |
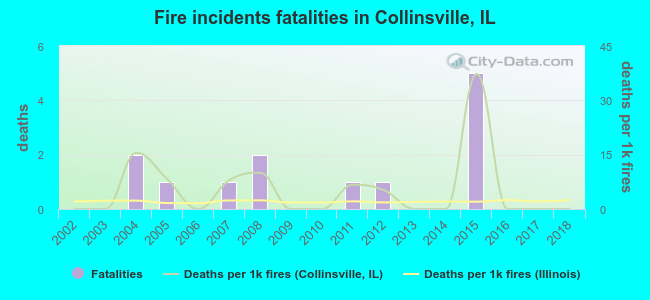 According to the data from the years 2002 - 2018 the average number of fire-related fatalities per year is 1. The highest number of reported deaths - 5 took place in 2015, and the lowest - 0 in 2002. The data has a constant trend.
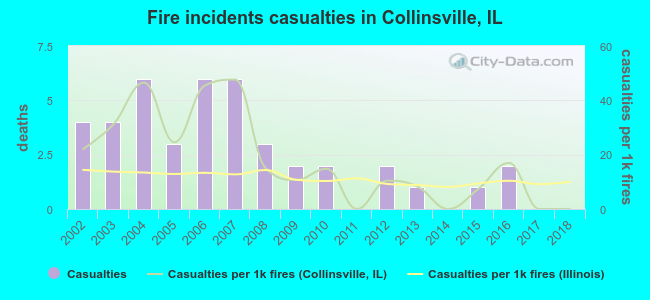 Based on the data from the years 2002 - 2018 the average number of fire-related yearly casualties is 2. The highest number of reported casualties - 6 took place in 2004, and the lowest - 0 in 2011. The data has a dropping trend.
The average number of casualties per 1,000 fires is 18. This indicator was the highest - 48 in 2007, and the lowest 0 in 2011. The trend for injuries per 1,000 fires is dropping. Compared to the state value the number of casualties per 1,000 fires is higher.
Based on the data from the years 2002 - 2018 the average number of fire-related yearly casualties is 2. The highest number of reported casualties - 6 took place in 2004, and the lowest - 0 in 2011. The data has a dropping trend.
The average number of casualties per 1,000 fires is 18. This indicator was the highest - 48 in 2007, and the lowest 0 in 2011. The trend for injuries per 1,000 fires is dropping. Compared to the state value the number of casualties per 1,000 fires is higher.Casualties per 1,000 incidents in Collinsville, IL compared to nearest cities:
(Note: Based on data for all years, including only cities with at least 500 fire incidents)
| Collinsville: | 16.9 |
| Caseyville: | 1.5 |
| Pontoon Beach: | 2.2 |
| Fairview Heights: | 17.3 |
| Washington Park: | 3.0 |
| Troy: | 3.5 |
| Granite City: | 19.8 |
| East St. Louis: | 2.3 |
| Madison: | 2.0 |
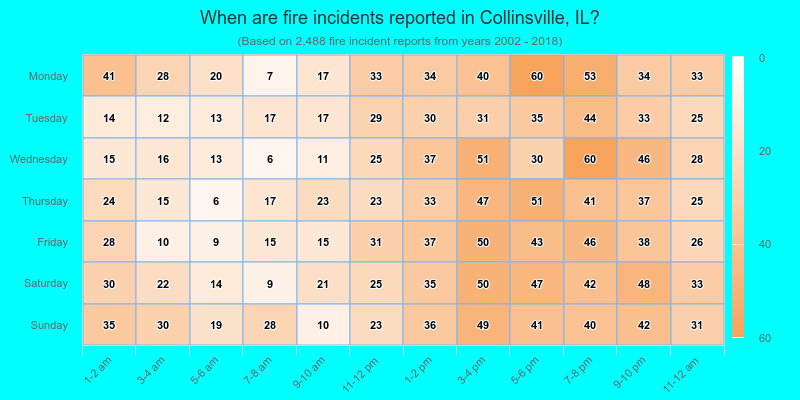
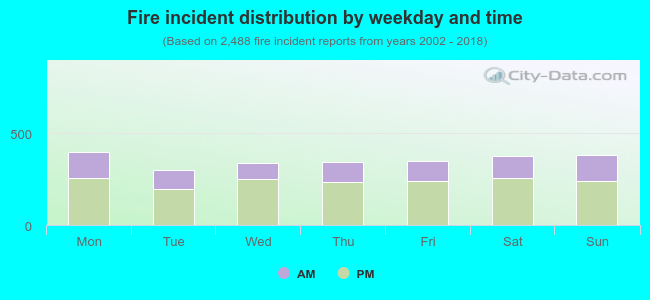 32.8% incidents where reported in the morning and 67.2% in the evening. The most fires (16.1%) took place on Monday, and the least (12.1%) on Tuesday.
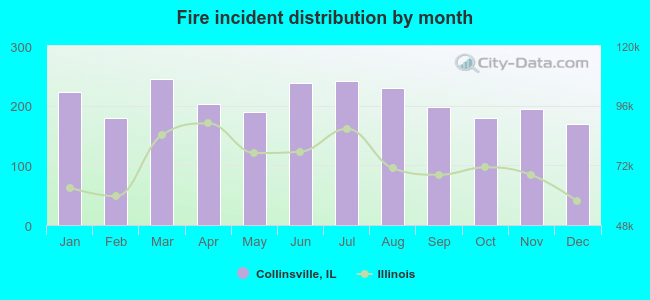 According to the 2,488 reports from years 2002 - 2018 most fires (9.8%) took place during March, and the least (6.8%) in December.
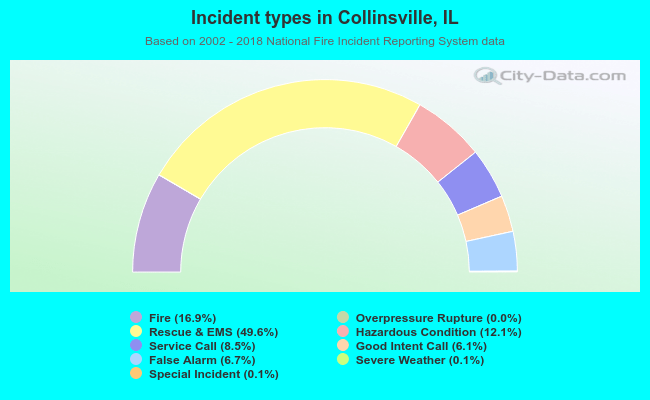 Out of all 14,764 cases reported during the years 2002 - 2018, the most belonged to the categories: Rescue & EMS (49.6%), Fire (16.9%), and Hazardous Condition (12.1%).
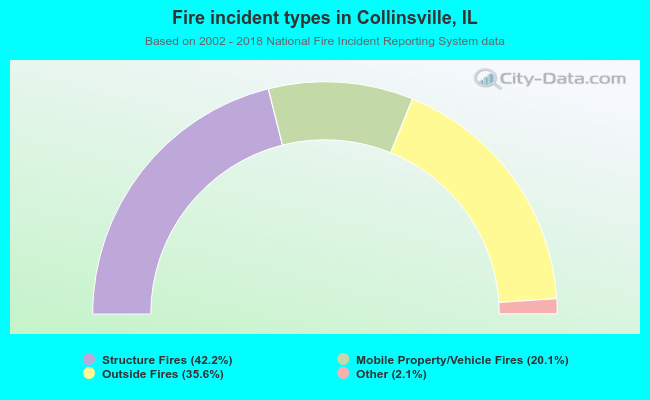 When looking into fire subcategories, the most incidents belonged to: Structure Fires (42.2%), and Outside Fires (35.6%).