Port Orange: Fire Incidents, Florida (FL)
Where are fire incidents reported in Port Orange, FL
Something went wrong! Please refresh the page.
| Fire incidents reported | |
|---|---|
| Sreet name | Count |
| NOVA RD | 236 |
| DUNLAWTON AVE | 204 |
| RIDGEWOOD AVE | 188 |
| TOMOKA FARMS RD | 146 |
| WILLIAMSON BLVD | 132 |
| CLYDE MORRIS BLVD | 124 |
| I95 | 102 |
| TAYLOR RD | 102 |
| I-95 | 96 |
| REED CANAL RD | 76 |
| SHUNZ RD | 60 |
| I95 HWY | 54 |
| HALIFAX DR | 52 |
| SPRUCE CREEK RD | 46 |
| AIRPORT RD | 44 |
| HERBERT ST | 44 |
| ATLANTIC AVE | 40 |
| DUNLAWTON | 36 |
| HIDDEN LAKE DR | 36 |
| RIDGEWOOD | 36 |
| RICHEL DR | 30 |
| WOOD ST | 30 |
| FOREST BRANCH DR | 28 |
| GREENWAY DR | 28 |
| LESLIE DR | 28 |
| ORANGE AVE | 28 |
| SPRUCE VIEW WAY | 28 |
| MADELINE AVE | 26 |
| FREDERICK AVE | 22 |
| GUAVA DR | 22 |
| Other | 265 |
2002 - 2018 National Fire Incident Reporting System (NFIRS) incidents
- Incident types reported to NFIRS in Port Orange, FL
- 31,71262.5%Rescue & EMS
- 5,51510.9%Good Intent Call
- 4,9879.8%Service Call
- 3,0506.0%Hazardous Condition
- 2,3894.7%Fire
- 1,8123.6%Special Incident
- 1,2672.5%False Alarm
- Fire incident types reported to NFIRS in Port Orange, FL
- 1,06944.7%Outside Fires
- 83234.8%Structure Fires
- 40617.0%Mobile Property/Vehicle Fires
- 823.4%Other
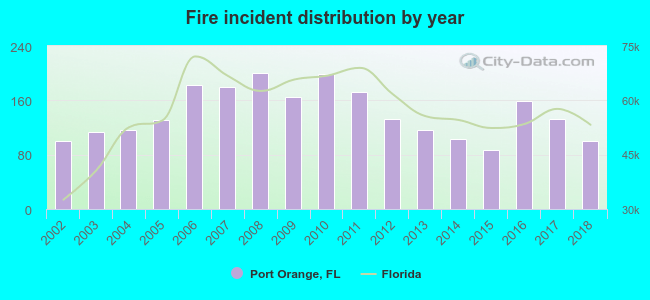 According to the data from the years 2002 - 2018 the average number of fire incidents per year is 141. The highest number of fire incidents - 200 took place in 2008, and the least - 87 in 2015. The data has a constant trend.
The average number of yearly fire incidents per 10k residents in Port Orange, FL compared to nearest cities:
(Note: Based on data for the last 3 years, including only cities with population 5,000 and above)
| Port Orange: | 22.2 |
| South Daytona: | 8.3 |
| Daytona Beach: | 60.0 |
| New Smyrna Beach: | 81.6 |
| Holly Hill: | 49.3 |
| Edgewater: | 35.8 |
| Ormond Beach: | 53.8 |
| Deltona: | 25.0 |
| Orange City: | 114.3 |
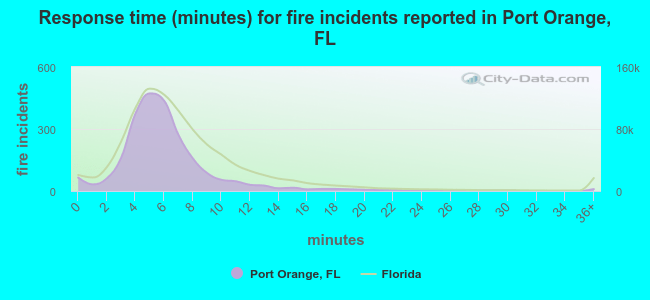 The median response time based on all reported fire incidents is 6 minutes. This is similar to the Florida median value.
The median response time in Port Orange, FL compared to nearest cities:
(Note: Based on data for all years, including only cities with at least 500 fire incidents)
| Port Orange: | 6 minutes |
| Daytona Beach: | 5 minutes |
| New Smyrna Beach: | 6 minutes |
| Holly Hill: | 5 minutes |
| Edgewater: | 5 minutes |
| Ormond Beach: | 6 minutes |
| Deltona: | 6 minutes |
| Orange City: | 5 minutes |
| Geneva: | 8 minutes |
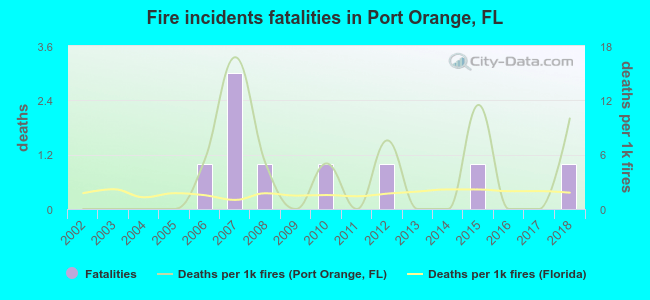 According to the reports from the years 2002 - 2018 the average number of fire-related fatalities per year is 1. The highest number of reported deaths - 3 took place in 2007, and the lowest - 0 in 2002. The data has a growing trend.
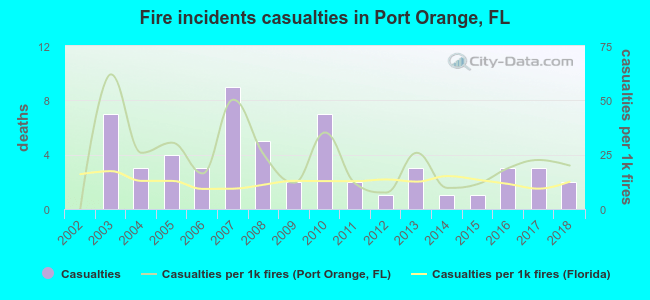 According to the data from the years 2002 - 2018 the average number of fire-related casualties per year is 3. The highest number of casualties - 9 took place in 2007, and the lowest - 0 in 2002. The data has a rising trend.
The average number of injuries per 1,000 fire incidents is 23. This indicator was the highest - 62 in 2003, and the lowest 0 in 2002. The trend for injuries per 1,000 fire incidents is growing. Compared to the state value the number of injuries per 1,000 fire incidents is higher.
According to the data from the years 2002 - 2018 the average number of fire-related casualties per year is 3. The highest number of casualties - 9 took place in 2007, and the lowest - 0 in 2002. The data has a rising trend.
The average number of injuries per 1,000 fire incidents is 23. This indicator was the highest - 62 in 2003, and the lowest 0 in 2002. The trend for injuries per 1,000 fire incidents is growing. Compared to the state value the number of injuries per 1,000 fire incidents is higher.Casualties per 1,000 incidents in Port Orange, FL compared to nearest cities:
(Note: Based on data for all years, including only cities with at least 500 fire incidents)
| Port Orange: | 23.4 |
| Daytona Beach: | 23.2 |
| New Smyrna Beach: | 12.0 |
| Holly Hill: | 16.9 |
| Edgewater: | 29.5 |
| Ormond Beach: | 9.9 |
| Deltona: | 33.1 |
| Orange City: | 11.2 |
| Geneva: | 20.3 |
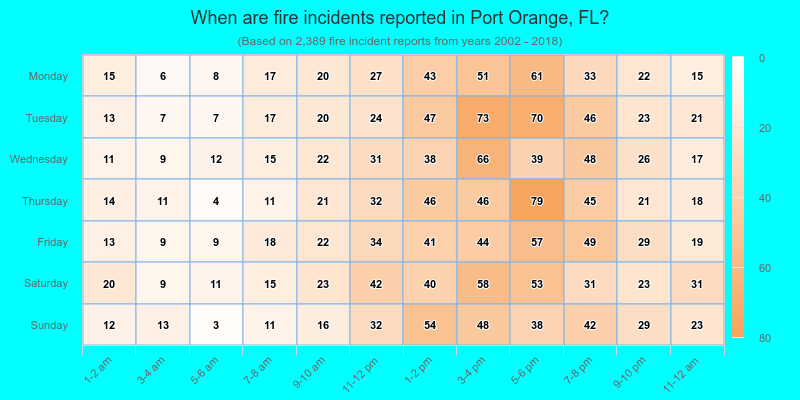
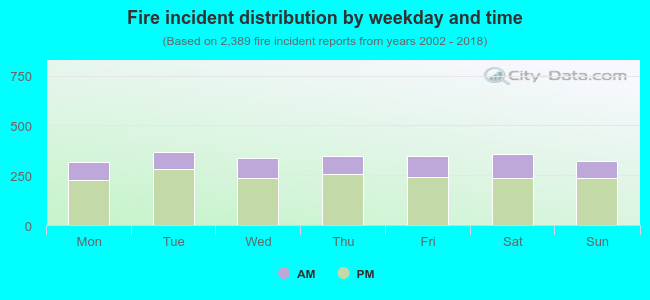 28.7% incidents where reported in the morning and 71.3% in the evening. The most fires (15.4%) took place on Tuesday, and the least (13.3%) on Monday.
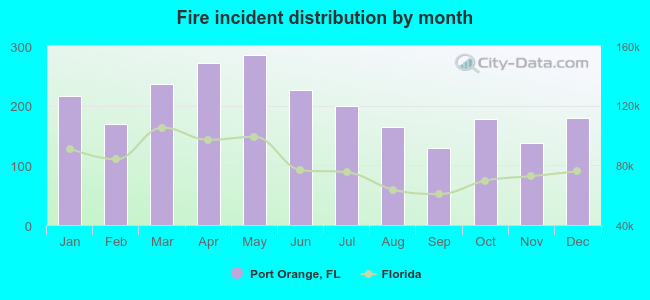 According to the 2,389 fire incidents from years 2002 - 2018 most fires (11.9%) took place during May, and the least (5.4%) in September.
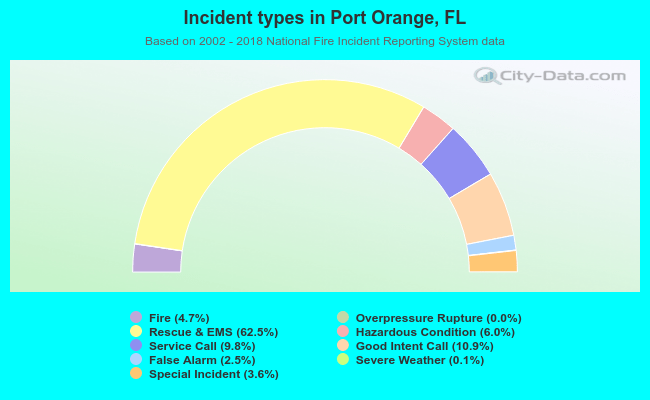 Out of all 50,773 cases reported during the years 2002 - 2018, the most belonged to the categories: Rescue & EMS (62.5%), Good Intent Call (10.9%), and Service Call (9.8%).
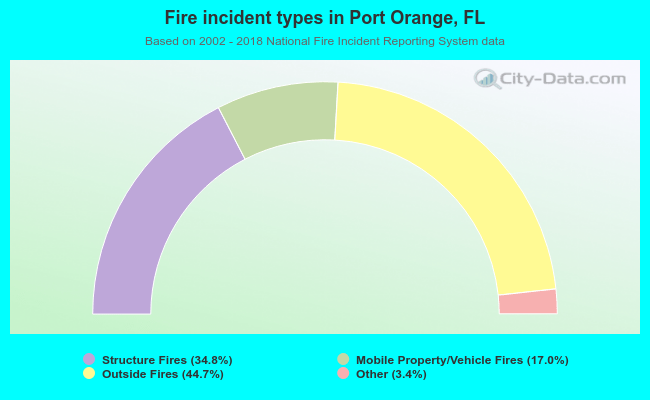 When looking into fire subcategories, the most incidents belonged to: Outside Fires (44.7%), and Structure Fires (34.8%).