Orange City: Fire Incidents, Florida (FL)
Where are fire incidents reported in Orange City, FL
Something went wrong! Please refresh the page.
| Fire incidents reported | |
|---|---|
| Sreet name | Count |
| LEAVITT AVE | 348 |
| SAXON BLVD | 228 |
| VOLUSIA AVE | 192 |
| INTERSTATE 4 | 164 |
| ENTERPRISE RD | 154 |
| GRAVES AVE | 150 |
| VETERANS MEMORIAL PKY | 138 |
| FRENCH AVE | 76 |
| HARLEY STRICKLAND BLVD | 36 |
| GRAVES AV | 34 |
| VOLUSIA AV | 30 |
| 6TH ST | 28 |
| CARPENTER AVE | 28 |
| FRENCH | 28 |
| LANSDOWNE AVE | 28 |
| VOLUSIA | 26 |
| BLUE SPRINGS AVE | 24 |
| RHODE ISLAND AVE | 24 |
| SR 472 | 24 |
| GARDENIA DR | 22 |
| GRAVES | 22 |
| I4 | 22 |
| 472 | 20 |
| FRENCH AV | 20 |
| INDUSTRIAL DR | 20 |
| SPARKMAN | 20 |
| 20TH ST | 18 |
| FERN DR | 18 |
| MINNESOTA AV | 18 |
| SPARKMAN AVE | 18 |
| Other | 166 |
2002 - 2018 National Fire Incident Reporting System (NFIRS) incidents
- Incident types reported to NFIRS in Orange City, FL
- 18,38459.5%Rescue & EMS
- 3,86712.5%Service Call
- 2,7538.9%Good Intent Call
- 2,4167.8%Hazardous Condition
- 2,1446.9%Fire
- 1,2744.1%False Alarm
- 350.1%Severe Weather
- Fire incident types reported to NFIRS in Orange City, FL
- 1,07650.2%Outside Fires
- 58727.4%Structure Fires
- 39618.5%Mobile Property/Vehicle Fires
- 854.0%Other
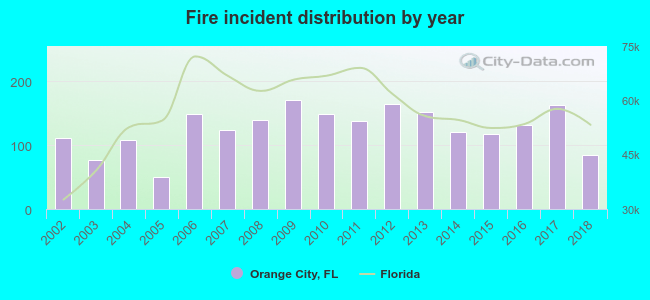 According to the data from the years 2002 - 2018 the average number of fire incidents per year is 126. The highest number of fire incidents - 170 took place in 2009, and the least - 50 in 2005. The data has a decreasing trend.
The average number of yearly fire incidents per 10k residents in Orange City, FL compared to nearest cities:
(Note: Based on data for the last 3 years, including only cities with population 5,000 and above)
| Orange City: | 114.3 |
| Deltona: | 25.0 |
| Sanford: | 49.8 |
| Lake Mary: | 18.4 |
| Longwood: | 38.7 |
| Winter Springs: | 11.3 |
| Casselberry: | 16.5 |
| Altamonte Springs: | 16.7 |
| Oviedo: | 19.3 |
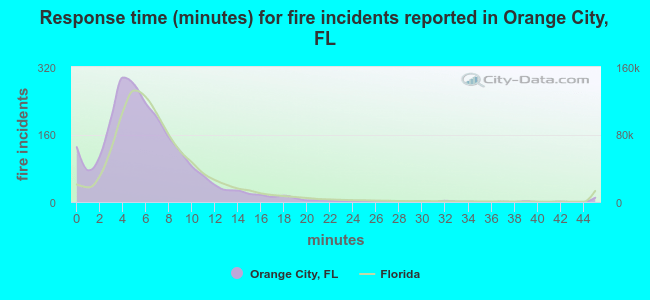 The median response time based on all reported fire incidents is 5 minutes. This is lower compared to the Florida median value.
The median response time in Orange City, FL compared to nearest cities:
(Note: Based on data for all years, including only cities with at least 500 fire incidents)
| Orange City: | 5 minutes |
| Deltona: | 6 minutes |
| Sanford: | 6 minutes |
| Lake Mary: | 6 minutes |
| Longwood: | 5 minutes |
| Winter Springs: | 5 minutes |
| Geneva: | 8 minutes |
| Sorrento: | 8 minutes |
| Casselberry: | 5 minutes |
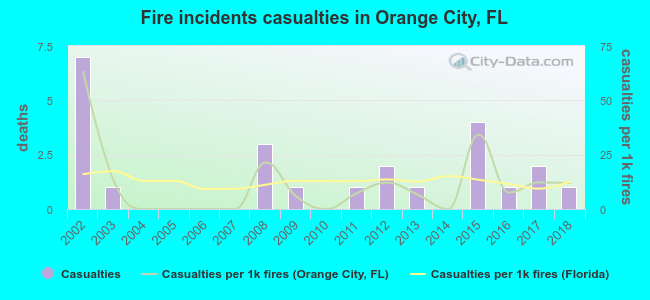 Based on the reports from the years 2002 - 2018 the average number of fire-related yearly casualties is 1. The highest number of reported casualties - 7 took place in 2002, and the lowest - 0 in 2004. The data has a declining trend.
The average number of injuries per 1,000 fires is 12. This indicator was the highest - 63 in 2002, and the lowest 0 in 2004. The trend for injuries per 1,000 fire incidents is dropping. Compared to the state value the number of casualties per 1,000 incidents is similar.
Based on the reports from the years 2002 - 2018 the average number of fire-related yearly casualties is 1. The highest number of reported casualties - 7 took place in 2002, and the lowest - 0 in 2004. The data has a declining trend.
The average number of injuries per 1,000 fires is 12. This indicator was the highest - 63 in 2002, and the lowest 0 in 2004. The trend for injuries per 1,000 fire incidents is dropping. Compared to the state value the number of casualties per 1,000 incidents is similar.Casualties per 1,000 incidents in Orange City, FL compared to nearest cities:
(Note: Based on data for all years, including only cities with at least 500 fire incidents)
| Orange City: | 11.2 |
| Deltona: | 33.1 |
| Sanford: | 13.4 |
| Lake Mary: | 20.7 |
| Longwood: | 29.7 |
| Winter Springs: | 36.7 |
| Geneva: | 20.3 |
| Sorrento: | 5.4 |
| Casselberry: | 20.4 |
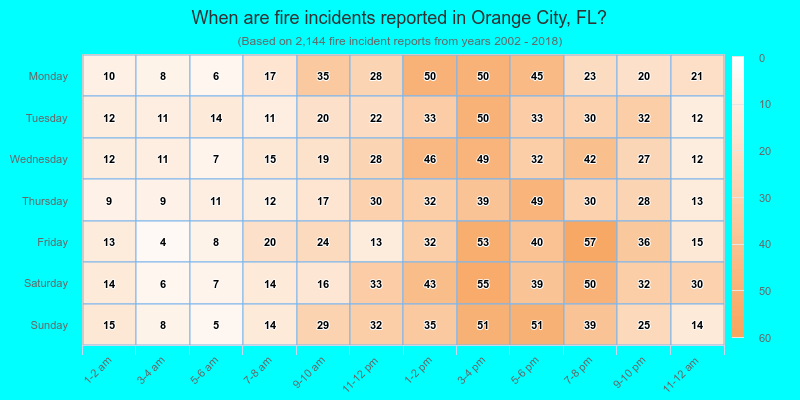
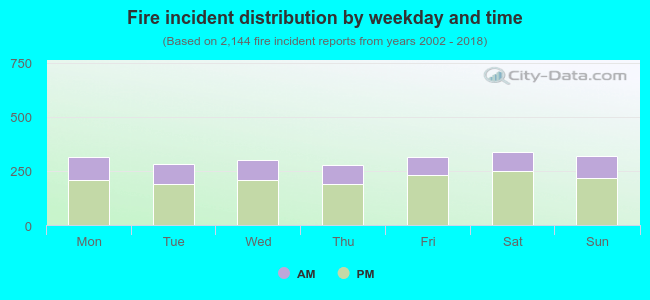 30.3% incidents where reported in the morning and 69.7% in the evening. The most fires (15.8%) took place on Saturday, and the least (13.0%) on Thursday.
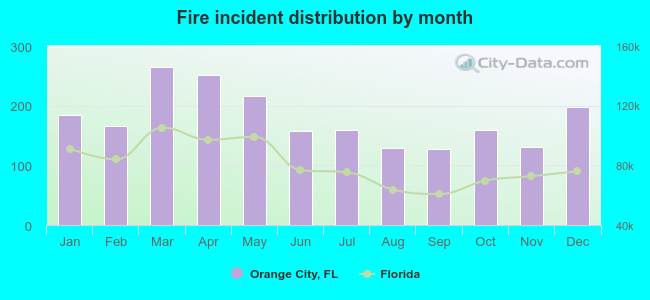 Based on the 2,144 fires from years 2002 - 2018 most fires (12.3%) took place during March, and the least (5.9%) in September.
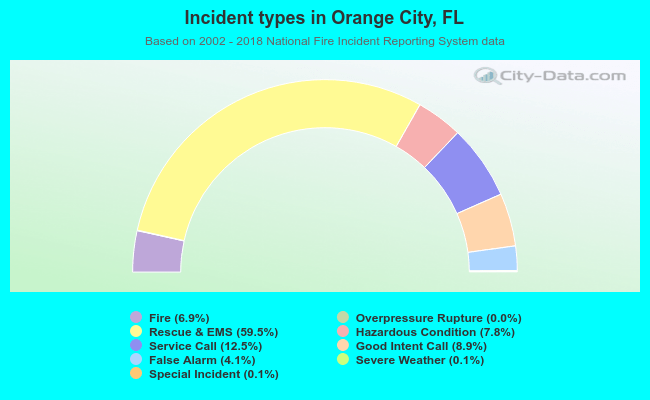 Out of all 30,914 cases reported during the years 2002 - 2018, the most belonged to the categories: Rescue & EMS (59.5%), Service Call (12.5%), and Good Intent Call (8.9%).
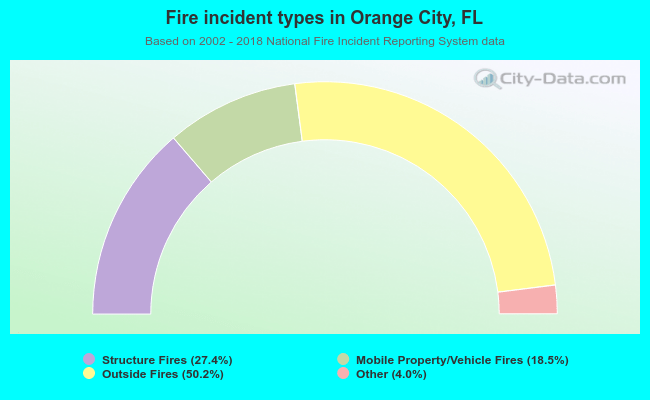 When looking into fire subcategories, the most incidents belonged to: Outside Fires (50.2%), and Structure Fires (27.4%).