Daytona Beach: Fire Incidents, Florida (FL)
Where are fire incidents reported in Daytona Beach, FL
Something went wrong! Please refresh the page.
| Fire incidents reported | |
|---|---|
| Sreet name | Count |
| INTL SPEEDWAY BLVD | 702 |
| NOVA RD | 346 |
| ATLANTIC AV | 342 |
| BEACH ST | 266 |
| CLYDE MORRIS BLVD | 248 |
| LPGA BLVD | 230 |
| RIDGEWOOD AV | 188 |
| BEVILLE RD | 170 |
| MASON AV | 168 |
| I4 | 136 |
| I95 | 124 |
| DERBYSHIRE RD | 122 |
| BILL FRANCE BLVD | 118 |
| I-95 | 116 |
| PENINSULA DR | 116 |
| JEAN ST | 112 |
| WILLIAMSON BLVD | 112 |
| BELLEVUE AV | 104 |
| JIMMY ANN DR | 104 |
| HALIFAX AV | 90 |
| BRENTWOOD DR | 72 |
| ATLANTIC | 70 |
| MAIN ST | 68 |
| OLEANDER AV | 68 |
| MADISON AV | 66 |
| ORANGE AV | 66 |
| PALMETTO AV | 66 |
| TOMOKA FARMS RD | 64 |
| CAROLINE ST | 62 |
| MARTIN LUTHER KING BLVD | 62 |
| Other | 1,364 |
2003 - 2018 National Fire Incident Reporting System (NFIRS) incidents
- Incident types reported to NFIRS in Daytona Beach, FL
- 60,18359.5%Rescue & EMS
- 17,99617.8%Good Intent Call
- 6,8036.7%Hazardous Condition
- 6,5396.5%Service Call
- 5,9425.9%Fire
- 3,5253.5%False Alarm
- Fire incident types reported to NFIRS in Daytona Beach, FL
- 2,76546.5%Outside Fires
- 1,85331.2%Structure Fires
- 1,15119.4%Mobile Property/Vehicle Fires
- 1732.9%Other
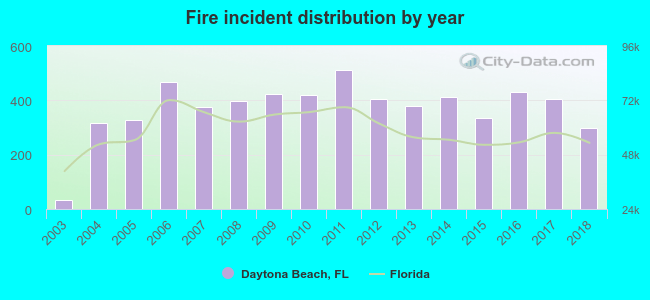 According to the data from the years 2003 - 2018 the average number of fires per year is 371. The highest number of fires - 512 took place in 2011, and the least - 32 in 2003. The data has an increasing trend.
The average number of yearly fire incidents per 10k residents in Daytona Beach, FL compared to nearest cities:
(Note: Based on data for the last 3 years, including only cities with population 5,000 and above)
| Daytona Beach: | 60.0 |
| Holly Hill: | 49.3 |
| South Daytona: | 8.3 |
| Ormond Beach: | 53.8 |
| Port Orange: | 22.2 |
| New Smyrna Beach: | 81.6 |
| Edgewater: | 35.8 |
| Deltona: | 25.0 |
| Orange City: | 114.3 |
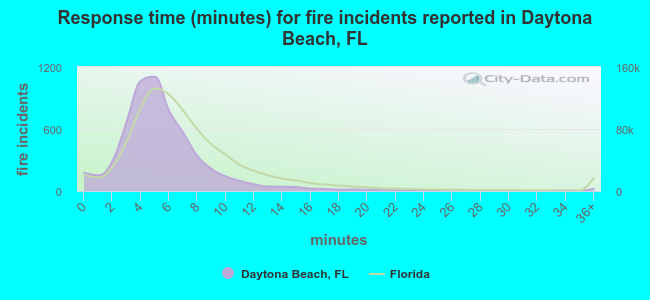 The median response time based on all reported fire incidents is 5 minutes. This is lower compared to the state median value.
The median response time in Daytona Beach, FL compared to nearest cities:
(Note: Based on data for all years, including only cities with at least 500 fire incidents)
| Daytona Beach: | 5 minutes |
| Holly Hill: | 5 minutes |
| Ormond Beach: | 6 minutes |
| Port Orange: | 6 minutes |
| New Smyrna Beach: | 6 minutes |
| Edgewater: | 5 minutes |
| Bunnell: | 12 minutes |
| Deltona: | 6 minutes |
| Orange City: | 5 minutes |
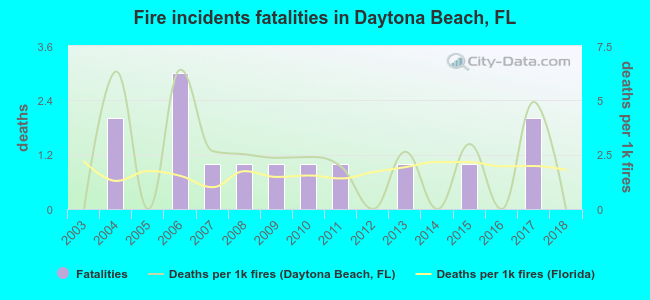 According to the data from the years 2003 - 2018 the average number of fire-related yearly deaths is 1. The highest number of deaths - 3 took place in 2006, and the lowest - 0 in 2003. The data has a constant trend.
The average number of deaths per 1,000 fires is 2. This indicator was the highest - 6 in 2006, and the lowest 0 in 2003. The trend for fatalities per 1,000 fire incidents is constant. Compared to the Florida value the number of fatalities per 1,000 fires is higher.
According to the data from the years 2003 - 2018 the average number of fire-related yearly deaths is 1. The highest number of deaths - 3 took place in 2006, and the lowest - 0 in 2003. The data has a constant trend.
The average number of deaths per 1,000 fires is 2. This indicator was the highest - 6 in 2006, and the lowest 0 in 2003. The trend for fatalities per 1,000 fire incidents is constant. Compared to the Florida value the number of fatalities per 1,000 fires is higher.Deaths per 1,000 incidents in Daytona Beach, FL compared to nearest cities:
(Note: Based on data for all years, including only cities with at least 2,500 fire incidents)
| Daytona Beach: | 2.4 |
| Ormond Beach: | 2.3 |
| Deltona: | 0.8 |
| Palm Coast: | 3.1 |
| Sanford: | 2.3 |
| Titusville: | 2.9 |
| Apopka: | 2.5 |
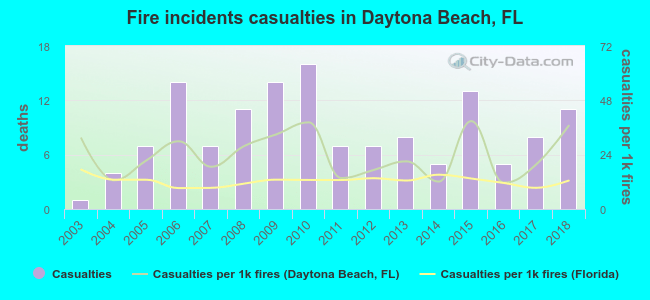 Based on the reports from the years 2003 - 2018 the average number of fire-related yearly casualties is 9. The highest number of injuries - 16 took place in 2010, and the lowest - 1 in 2003. The data has a growing trend.
The average number of casualties per 1,000 fire incidents is 24. This indicator was the highest - 39 in 2015, and the lowest 12 in 2016. The trend for casualties per 1,000 fires is rising. Compared to the Florida value the number of casualties per 1,000 fires is higher.
Based on the reports from the years 2003 - 2018 the average number of fire-related yearly casualties is 9. The highest number of injuries - 16 took place in 2010, and the lowest - 1 in 2003. The data has a growing trend.
The average number of casualties per 1,000 fire incidents is 24. This indicator was the highest - 39 in 2015, and the lowest 12 in 2016. The trend for casualties per 1,000 fires is rising. Compared to the Florida value the number of casualties per 1,000 fires is higher.Casualties per 1,000 incidents in Daytona Beach, FL compared to nearest cities:
(Note: Based on data for all years, including only cities with at least 500 fire incidents)
| Daytona Beach: | 23.2 |
| Holly Hill: | 16.9 |
| Ormond Beach: | 9.9 |
| Port Orange: | 23.4 |
| New Smyrna Beach: | 12.0 |
| Edgewater: | 29.5 |
| Bunnell: | 1.9 |
| Deltona: | 33.1 |
| Orange City: | 11.2 |
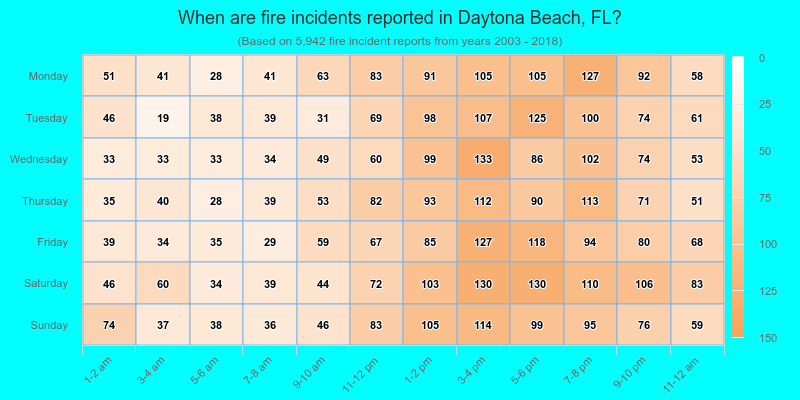
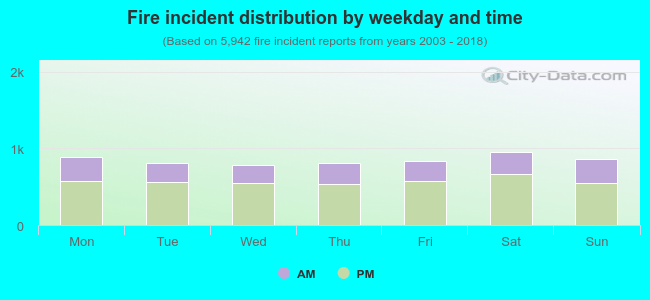 32.6% incidents where reported in the morning and 67.4% in the evening. The most fires (16.1%) took place on Saturday, and the least (13.3%) on Wednesday.
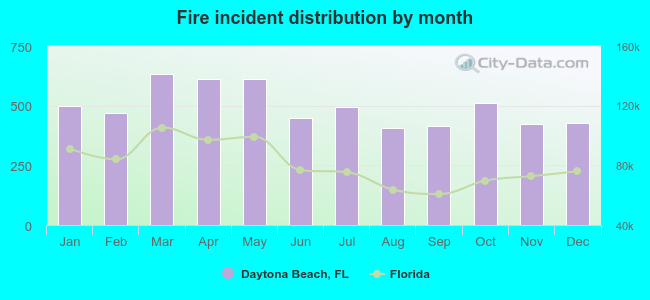 Based on the 5,942 fire incident reports from years 2003 - 2018 most fires (10.6%) took place during March, and the least (6.8%) in August.
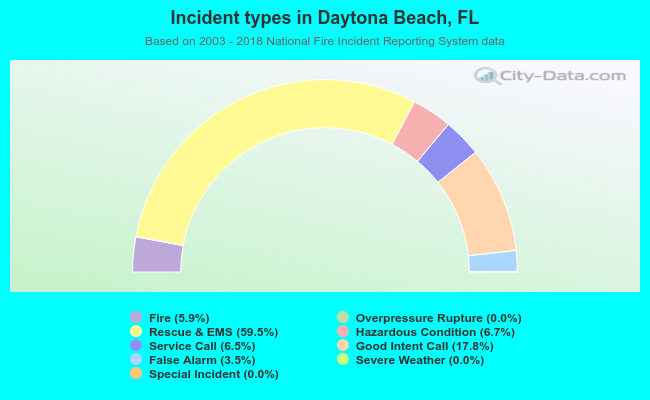 Out of all 101,079 cases reported during the years 2003 - 2018, the most belonged to the categories: Rescue & EMS (59.5%), Good Intent Call (17.8%), and Hazardous Condition (6.7%).
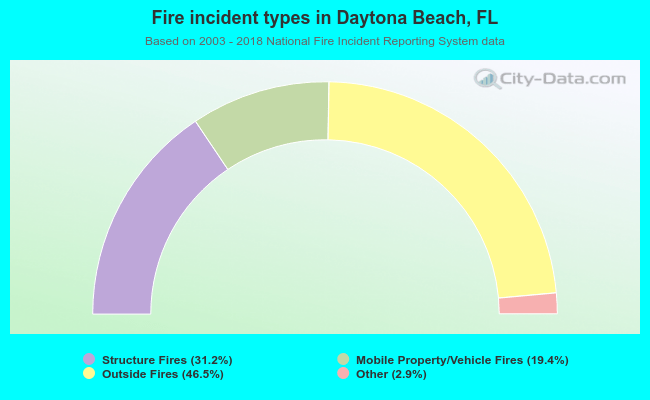 When looking into fire subcategories, the most reports belonged to: Outside Fires (46.5%), and Structure Fires (31.2%).