Rensselaer: Fire Incidents, Indiana (IN)
Where are fire incidents reported in Rensselaer, IN
Something went wrong! Please refresh the page.
|
| |||||||||||||||||||||||||||||||||||||||||||||||||||||||||||||||||||||||||||||||||||||||||||||||||||||||||||||
2002 - 2018 National Fire Incident Reporting System (NFIRS) incidents
- Incident types reported to NFIRS in Rensselaer, IN
- 48169.2%Fire
- 8912.8%Hazardous Condition
- 517.3%Good Intent Call
- 456.5%Rescue & EMS
- 152.2%False Alarm
- 142.0%Service Call
- Fire incident types reported to NFIRS in Rensselaer, IN
- 19941.4%Outside Fires
- 14329.7%Structure Fires
- 12526.0%Mobile Property/Vehicle Fires
- 142.9%Other
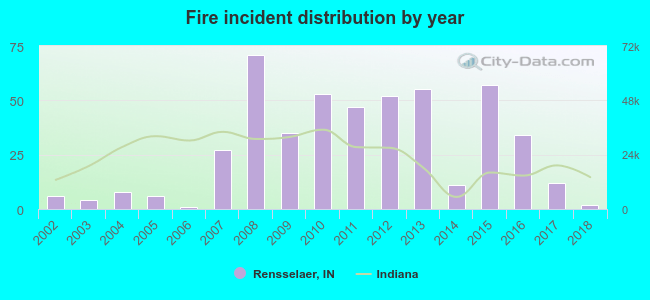 Based on the data from the years 2002 - 2018 the average number of fire incidents per year is 28. The highest number of fire incidents - 71 took place in 2008, and the least - 1 in 2006. The data has a declining trend.
The average number of yearly fire incidents per 10k residents in Rensselaer, IN compared to nearest cities:
(Note: Based on data for the last 3 years, including only cities with population 5,000 and above)
| Rensselaer: | 26.9 |
| Monticello: | 20.6 |
| Lowell: | 36.2 |
| Cedar Lake: | 8.9 |
| Crown Point: | 18.9 |
| West Lafayette: | 30.1 |
| Valparaiso: | 30.9 |

 35.6% incidents where reported in the morning and 64.4% in the evening. The most fires (16.6%) took place on Sunday, and the least (12.1%) on Thursday.
 Based on the 481 incident reports from years 2002 - 2018 most fires (13.1%) took place during April, and the least (4.0%) in January.
 Out of all 695 cases reported during the years 2002 - 2018, the most belonged to the categories: Fire (69.2%), Rescue & EMS (12.8%), and Service Call (7.3%).
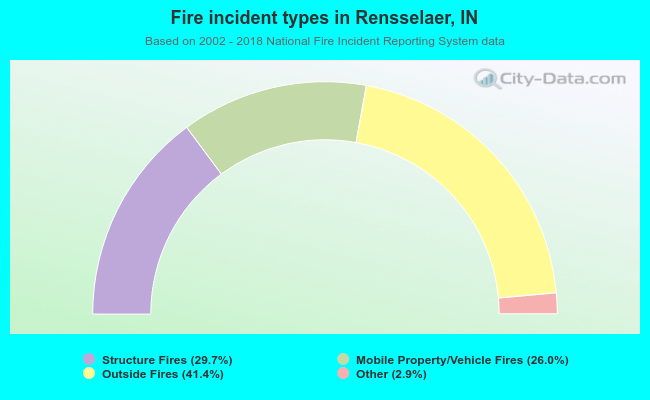 When looking into fire subcategories, the most incidents belonged to: Outside Fires (41.4%), and Structure Fires (29.7%).