Crown Point: Fire Incidents, Indiana (IN)
Where are fire incidents reported in Crown Point, IN
Something went wrong! Please refresh the page.
| Fire incidents reported | |
|---|---|
| Sreet name | Count |
| MAIN ST | 196 |
| 109TH AVE | 102 |
| NORTH ST | 78 |
| BROADWAY | 72 |
| 117TH AVE | 64 |
| 129TH AVE | 58 |
| 93RD AVE | 58 |
| COURT ST | 54 |
| 121ST AVE | 52 |
| 101ST AVE | 48 |
| BURR ST | 46 |
| IOWA ST | 44 |
| 133RD AVE | 42 |
| I-65 | 42 |
| INDIANA AVE | 40 |
| RANDOLPH ST | 40 |
| 85TH AVE | 38 |
| SOUTH ST | 38 |
| CLINE AVE | 36 |
| DELAWARE ST | 36 |
| 113TH AVE | 32 |
| FRANCISCAN DR | 32 |
| JOLIET ST | 32 |
| CEDAR POINT DR | 26 |
| MARSHALL ST | 26 |
| PORTER ST | 26 |
| SUNNYSLOPE DR | 26 |
| CHASE ST | 24 |
| KINGSWAY DR | 24 |
| SUMMIT ST | 24 |
| Other | 626 |
2003 - 2017 National Fire Incident Reporting System (NFIRS) incidents
- Incident types reported to NFIRS in Crown Point, IN
- 5,45151.5%Rescue & EMS
- 2,08219.7%Fire
- 1,73716.4%Hazardous Condition
- 4984.7%False Alarm
- 3803.6%Service Call
- 3803.6%Good Intent Call
- 330.3%Special Incident
- Fire incident types reported to NFIRS in Crown Point, IN
- 81239.0%Outside Fires
- 79138.0%Structure Fires
- 27513.2%Mobile Property/Vehicle Fires
- 2049.8%Other
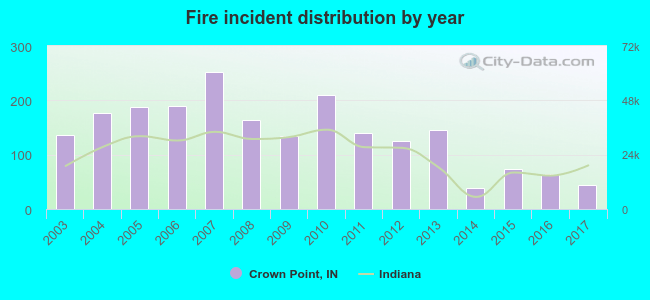 Based on the data from the years 2003 - 2017 the average number of fires per year is 139. The highest number of fire incidents - 253 took place in 2007, and the least - 39 in 2014. The data has a decreasing trend.
The average number of yearly fire incidents per 10k residents in Crown Point, IN compared to nearest cities:
(Note: Based on data for the last 3 years, including only cities with population 5,000 and above)
| Crown Point: | 18.9 |
| Merrillville: | 23.5 |
| Cedar Lake: | 8.9 |
| Schererville: | 13.3 |
| Griffith: | 3.6 |
| Hobart: | 1.4 |
| Lowell: | 36.2 |
| Dyer: | 18.9 |
| Highland: | 16.3 |
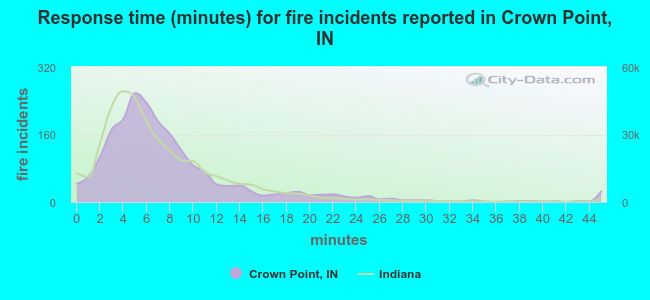 The median response time based on all reported fire incidents is 6 minutes. This is similar to the state median value.
The median response time in Crown Point, IN compared to nearest cities:
(Note: Based on data for all years, including only cities with at least 500 fire incidents)
| Crown Point: | 6 minutes |
| Merrillville: | 5 minutes |
| Cedar Lake: | 7 minutes |
| Schererville: | 7 minutes |
| Hobart: | 5 minutes |
| Lowell: | 9 minutes |
| Dyer: | 7 minutes |
| Highland: | 7 minutes |
| Hebron: | 9 minutes |
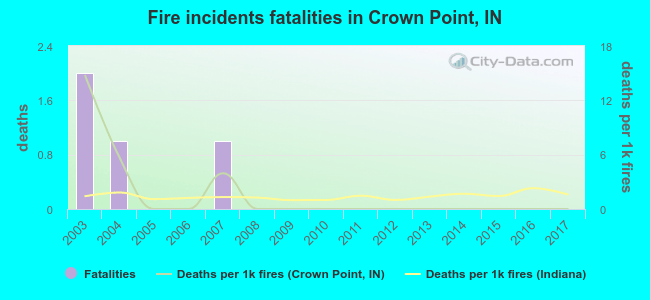 According to the data from the years 2003 - 2017 the average number of fire-related fatalities per year is 0. The highest number of deaths - 2 took place in 2003, and the lowest - 0 in 2005. The data has a dropping trend.
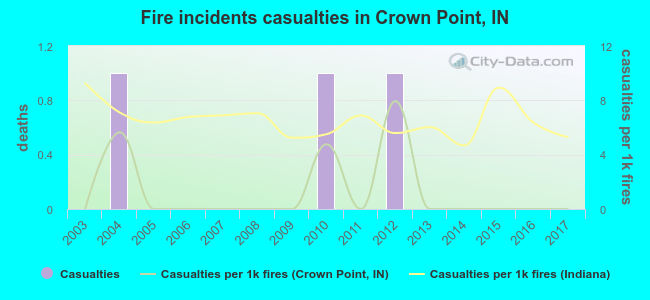 Based on the data from the years 2003 - 2017 the average number of fire-related casualties per year is 0. The highest number of casualties - 1 took place in 2004, and the lowest - 0 in 2003. The data has a constant trend.
The average number of injuries per 1,000 fires is 1. This indicator was the highest - 8 in 2012, and the lowest 0 in 2003. The trend for injuries per 1,000 fires is constant. Compared to the state value the number of casualties per 1,000 incidents is much lower.
Based on the data from the years 2003 - 2017 the average number of fire-related casualties per year is 0. The highest number of casualties - 1 took place in 2004, and the lowest - 0 in 2003. The data has a constant trend.
The average number of injuries per 1,000 fires is 1. This indicator was the highest - 8 in 2012, and the lowest 0 in 2003. The trend for injuries per 1,000 fires is constant. Compared to the state value the number of casualties per 1,000 incidents is much lower.Casualties per 1,000 incidents in Crown Point, IN compared to nearest cities:
(Note: Based on data for all years, including only cities with at least 500 fire incidents)
| Crown Point: | 1.4 |
| Merrillville: | 6.6 |
| Cedar Lake: | 1.5 |
| Schererville: | 3.9 |
| Hobart: | 16.3 |
| Lowell: | 2.7 |
| Dyer: | 9.6 |
| Highland: | 4.2 |
| Hebron: | 0.0 |
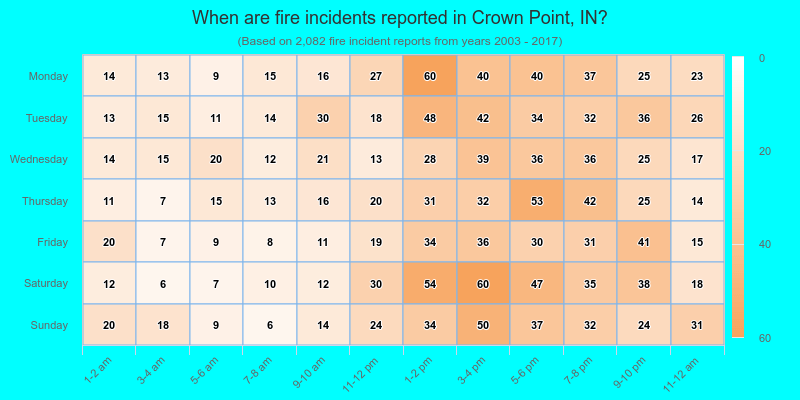
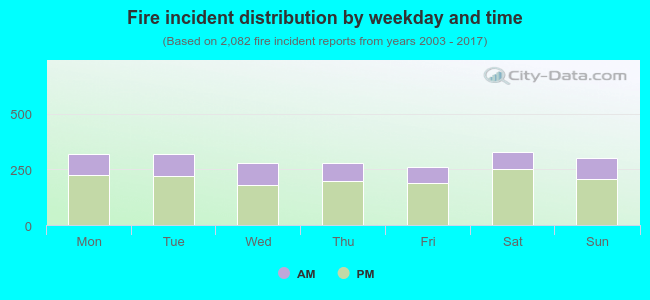 29.5% incidents where reported in the morning and 70.5% in the evening. The most fires (15.8%) took place on Saturday, and the least (12.5%) on Friday.
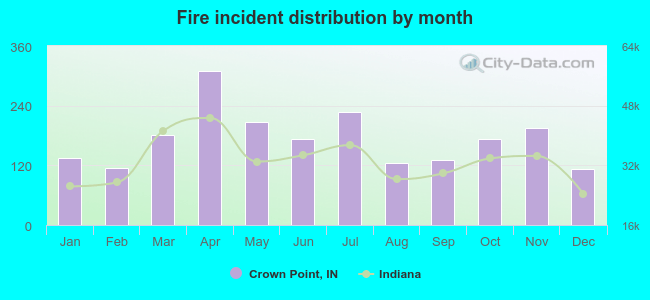 According to the 2,082 fire incident reports from years 2003 - 2017 most fires (14.8%) took place during April, and the least (5.4%) in December.
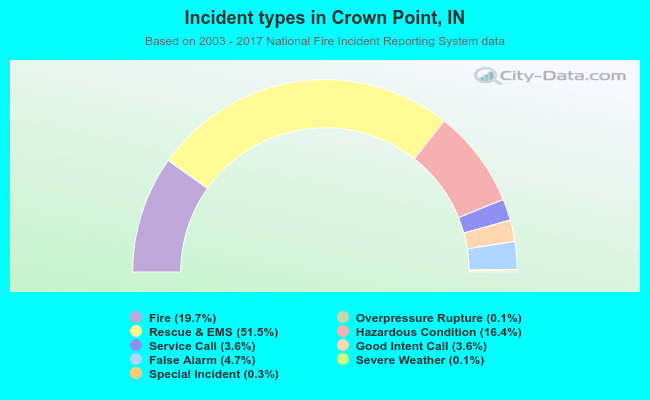 Out of all 10,577 cases reported during the years 2003 - 2017, the most belonged to the categories: Rescue & EMS (51.5%), Fire (19.7%), and Hazardous Condition (16.4%).
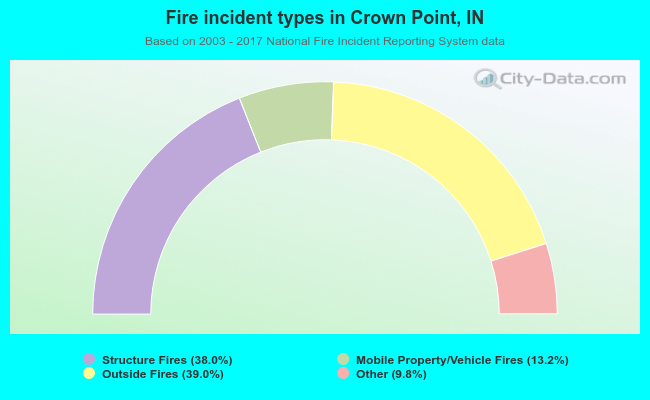 When looking into fire subcategories, the most reports belonged to: Outside Fires (39.0%), and Structure Fires (38.0%).