River Rouge: Fire Incidents, Michigan (MI)
Where are fire incidents reported in River Rouge, MI
Something went wrong! Please refresh the page.
|
| |||||||||||||||||||||||||||||||||||||||||||||||||||||||||||||||||||||||||||||||||||||||||||||||||||||||||||||
2002 - 2018 National Fire Incident Reporting System (NFIRS) incidents
- Incident types reported to NFIRS in River Rouge, MI
- 37240.8%Fire
- 20222.2%Rescue & EMS
- 14716.1%Hazardous Condition
- 9210.1%Good Intent Call
- 738.0%False Alarm
- 222.4%Service Call
- 30.3%Overpressure Rupture
- Fire incident types reported to NFIRS in River Rouge, MI
- 18950.8%Structure Fires
- 7921.2%Outside Fires
- 6818.3%Mobile Property/Vehicle Fires
- 369.7%Other
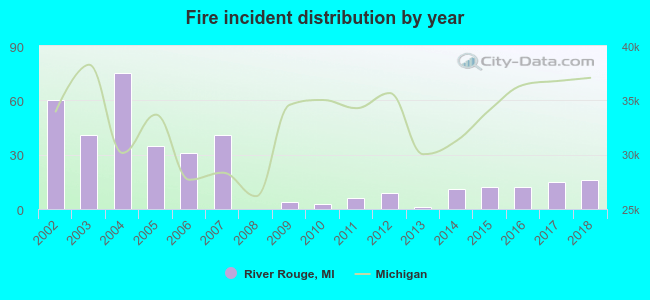 Based on the data from the years 2002 - 2018 the average number of fires per year is 22. The highest number of reported fire incidents - 75 took place in 2004, and the least - 0 in 2008. The data has a dropping trend.
The average number of yearly fire incidents per 10k residents in River Rouge, MI compared to nearest cities:
(Note: Based on data for the last 3 years, including only cities with population 5,000 and above)
| River Rouge: | 18.8 |
| Ecorse: | 49.0 |
| Melvindale: | 31.6 |
| Lincoln Park: | 28.0 |
| Allen Park: | 25.0 |
| Wyandotte: | 23.3 |
| Dearborn: | 28.1 |
| Southgate: | 18.0 |
| Taylor: | 28.1 |
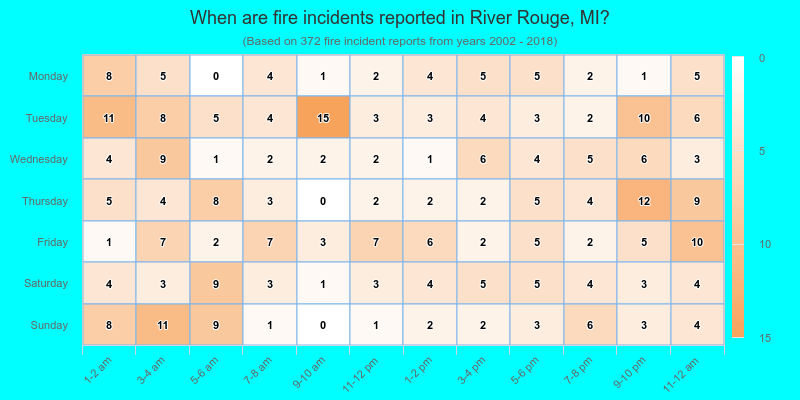
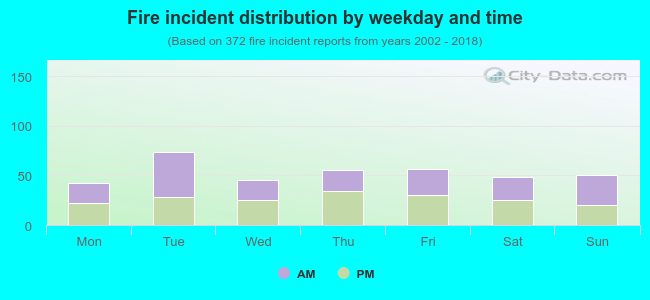 50.5% incidents where reported in the morning and 49.5% in the evening. The most fires (19.9%) took place on Tuesday, and the least (11.3%) on Monday.
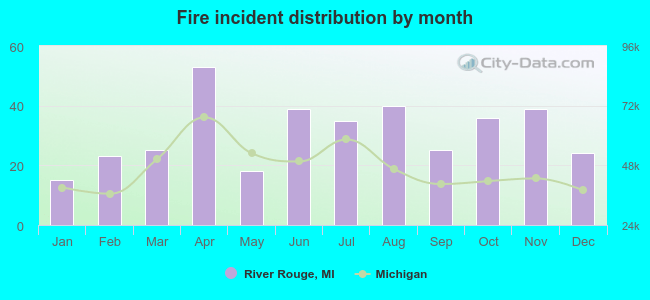 According to the 372 incident reports from years 2002 - 2018 most fires (14.2%) took place during April, and the least (4.0%) in January.
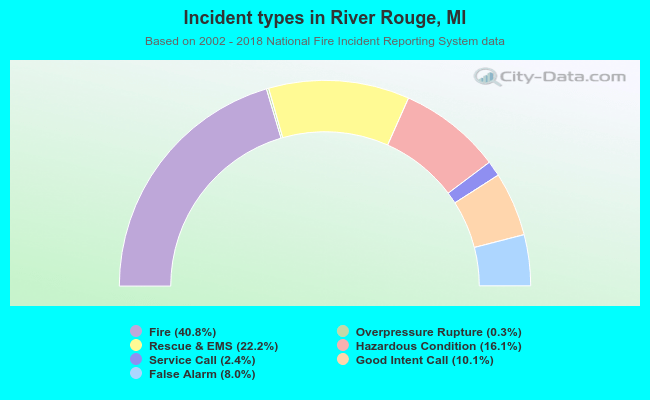 Out of all 911 cases reported during the years 2002 - 2018, the most belonged to the categories: Fire (40.8%), Rescue & EMS (22.2%), and Hazardous Condition (16.1%).
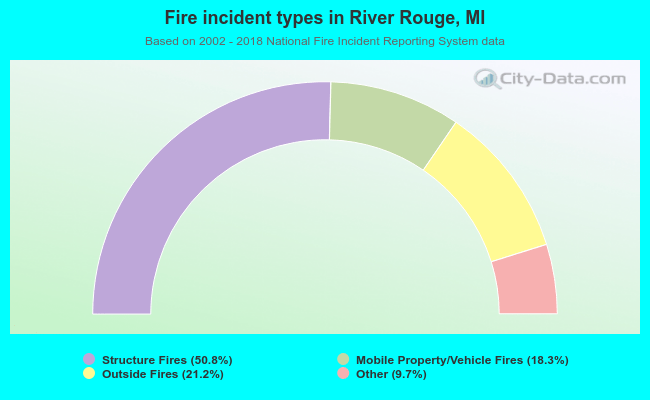 When looking into fire subcategories, the most incidents belonged to: Structure Fires (50.8%), and Outside Fires (21.2%).