Lincoln Park: Fire Incidents, Michigan (MI)
Where are fire incidents reported in Lincoln Park, MI
Something went wrong! Please refresh the page.
| Fire incidents reported | |
|---|---|
| Sreet name | Count |
| DIX | 308 |
| FORT | 232 |
| SOUTHFIELD | 156 |
| GODDARD | 96 |
| SOUTHFIELD RD | 84 |
| DIX AVE | 82 |
| ELECTRIC | 72 |
| FORT ST | 62 |
| FORT PARK | 54 |
| FISHER | 50 |
| I75 | 50 |
| LAFAYETTE | 50 |
| CLEVELAND | 44 |
| MONTIE | 44 |
| CHAMPAIGN | 42 |
| FERRIS | 36 |
| OUTER DRIVE | 36 |
| MILL | 34 |
| PARK | 34 |
| CHANDLER | 32 |
| CICOTTE | 32 |
| PAGEL | 32 |
| CHARTER | 30 |
| CLEOPHUS | 30 |
| GARFIELD | 30 |
| MCLAIN | 30 |
| RIVERBANK | 30 |
| MAYFLOWER | 28 |
| DETROIT | 26 |
| EMMONS | 26 |
2002 - 2018 National Fire Incident Reporting System (NFIRS) incidents
- Incident types reported to NFIRS in Lincoln Park, MI
- 7,60054.7%Rescue & EMS
- 2,48417.9%Hazardous Condition
- 1,81613.1%Fire
- 7895.7%Good Intent Call
- 6885.0%False Alarm
- 4873.5%Service Call
- 270.2%Special Incident
- Fire incident types reported to NFIRS in Lincoln Park, MI
- 80944.5%Structure Fires
- 51828.5%Outside Fires
- 39121.5%Mobile Property/Vehicle Fires
- 985.4%Other
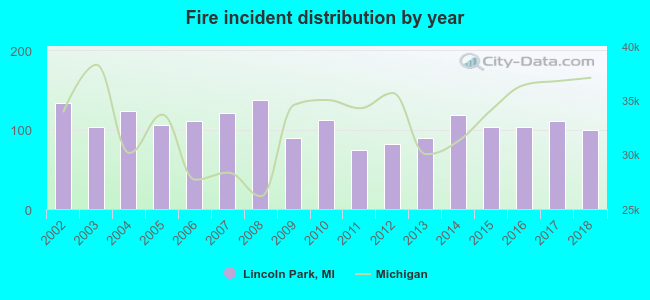 Based on the data from the years 2002 - 2018 the average number of fire incidents per year is 107. The highest number of reported fire incidents - 137 took place in 2008, and the least - 74 in 2011. The data has a declining trend.
The average number of yearly fire incidents per 10k residents in Lincoln Park, MI compared to nearest cities:
(Note: Based on data for the last 3 years, including only cities with population 5,000 and above)
| Lincoln Park: | 28.0 |
| Allen Park: | 25.0 |
| Ecorse: | 49.0 |
| Wyandotte: | 23.3 |
| Melvindale: | 31.6 |
| Southgate: | 18.0 |
| River Rouge: | 18.8 |
| Taylor: | 28.1 |
| Riverview: | 31.4 |
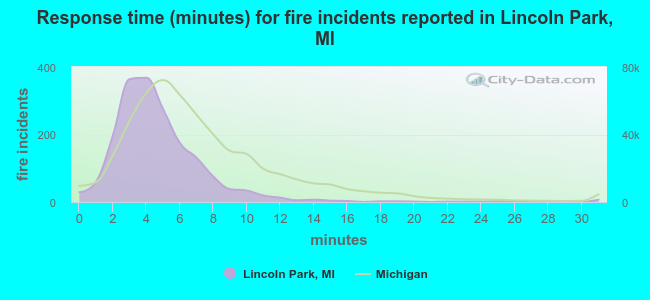 The median response time based on all reported fire incidents is 4 minutes. This is lower compared to the state median value.
The median response time in Lincoln Park, MI compared to nearest cities:
(Note: Based on data for all years, including only cities with at least 500 fire incidents)
| Lincoln Park: | 4 minutes |
| Allen Park: | 5 minutes |
| Wyandotte: | 4 minutes |
| Melvindale: | 3 minutes |
| Southgate: | 5 minutes |
| Taylor: | 4 minutes |
| Dearborn: | 4 minutes |
| Trenton: | 4 minutes |
| Dearborn Heights: | 6 minutes |
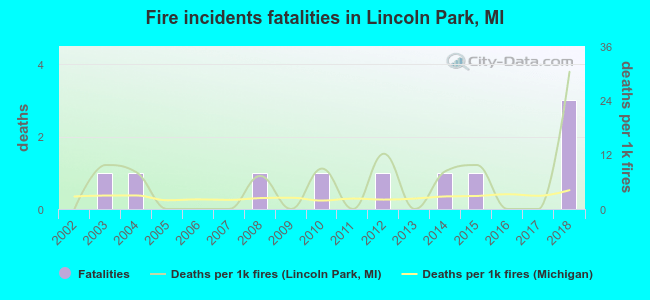 According to the reports from the years 2002 - 2018 the average number of fire-related fatalities per year is 1. The highest number of reported deaths - 3 took place in 2018, and the lowest - 0 in 2002. The data has a rising trend.
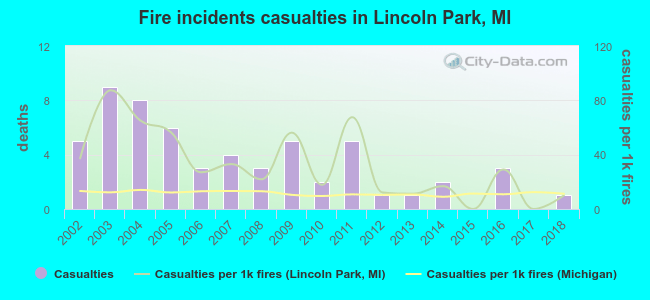 Based on the reports from the years 2002 - 2018 the average number of fire-related casualties per year is 3. The highest number of reported injuries - 9 took place in 2003, and the lowest - 0 in 2015. The data has a decreasing trend.
The average number of casualties per 1,000 fire incidents is 32. This indicator was the highest - 87 in 2003, and the lowest 0 in 2015. The trend for casualties per 1,000 fires is decreasing. Compared to the Michigan value the number of casualties per 1,000 fire incidents is much higher.
Based on the reports from the years 2002 - 2018 the average number of fire-related casualties per year is 3. The highest number of reported injuries - 9 took place in 2003, and the lowest - 0 in 2015. The data has a decreasing trend.
The average number of casualties per 1,000 fire incidents is 32. This indicator was the highest - 87 in 2003, and the lowest 0 in 2015. The trend for casualties per 1,000 fires is decreasing. Compared to the Michigan value the number of casualties per 1,000 fire incidents is much higher.Casualties per 1,000 incidents in Lincoln Park, MI compared to nearest cities:
(Note: Based on data for all years, including only cities with at least 500 fire incidents)
| Lincoln Park: | 31.9 |
| Allen Park: | 3.9 |
| Wyandotte: | 26.9 |
| Melvindale: | 30.6 |
| Southgate: | 14.5 |
| Taylor: | 19.3 |
| Dearborn: | 23.8 |
| Trenton: | 20.4 |
| Dearborn Heights: | 21.4 |
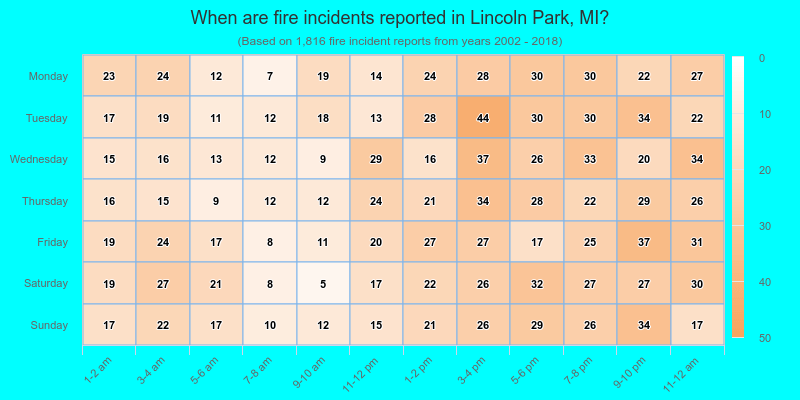
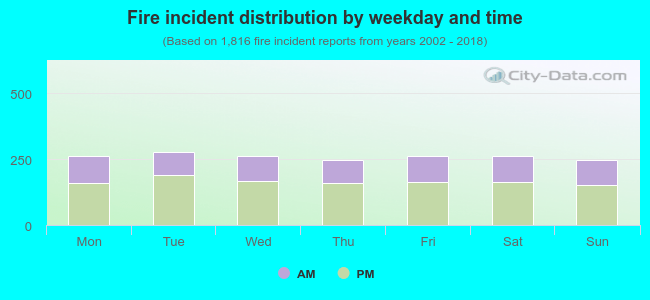 36.3% incidents where reported in the morning and 63.7% in the evening. The most fires (15.3%) took place on Tuesday, and the least (13.5%) on Sunday.
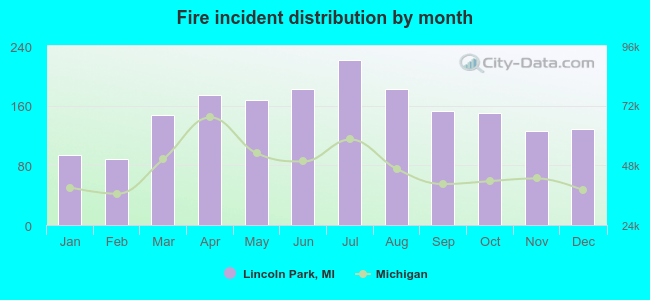 Based on the 1,816 reports from years 2002 - 2018 most fires (12.2%) took place during July, and the least (4.9%) in February.
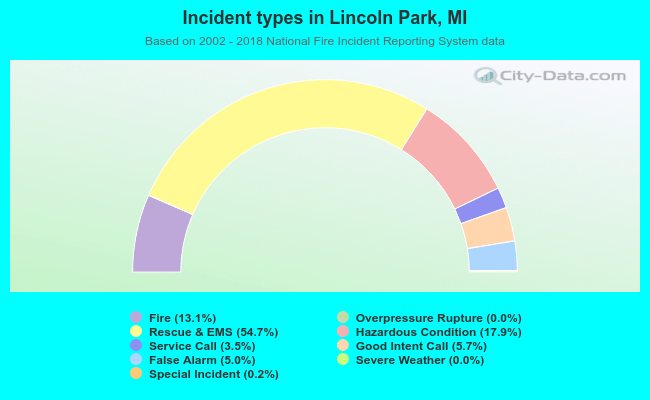 Out of all 13,898 cases reported during the years 2002 - 2018, the most belonged to the categories: Rescue & EMS (54.7%), Hazardous Condition (17.9%), and Fire (13.1%).
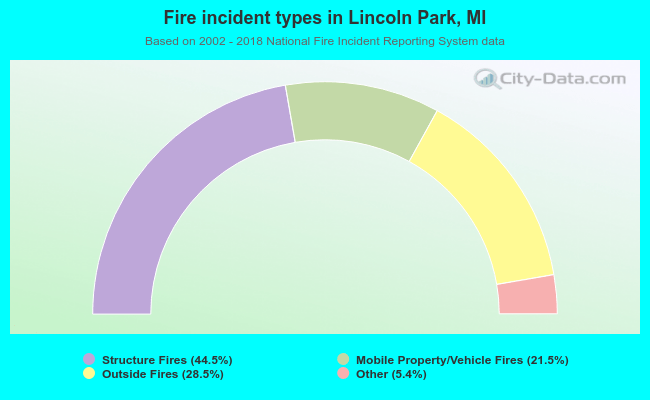 When looking into fire subcategories, the most reports belonged to: Structure Fires (44.5%), and Outside Fires (28.5%).