Ecorse: Fire Incidents, Michigan (MI)
Where are fire incidents reported in Ecorse, MI
Something went wrong! Please refresh the page.
|
| |||||||||||||||||||||||||||||||||||||||||||||||||||||||||||||||||||||||||||||||||||||||||||||||||||||||||||||
2002 - 2018 National Fire Incident Reporting System (NFIRS) incidents
- Incident types reported to NFIRS in Ecorse, MI
- 1,93956.3%Rescue & EMS
- 44112.8%Hazardous Condition
- 41712.1%Fire
- 35210.2%False Alarm
- 2226.4%Service Call
- 511.5%Good Intent Call
- 200.6%Special Incident
- 50.1%Overpressure Rupture
- Fire incident types reported to NFIRS in Ecorse, MI
- 21150.6%Structure Fires
- 9422.5%Outside Fires
- 6214.9%Mobile Property/Vehicle Fires
- 5012.0%Other
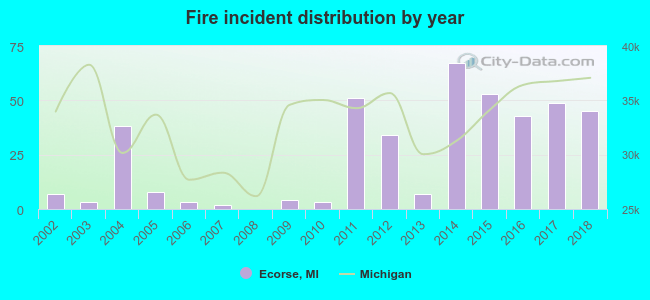 Based on the data from the years 2002 - 2018 the average number of fire incidents per year is 25. The highest number of fire incidents - 67 took place in 2014, and the least - 0 in 2008. The data has an increasing trend.
The average number of yearly fire incidents per 10k residents in Ecorse, MI compared to nearest cities:
(Note: Based on data for the last 3 years, including only cities with population 5,000 and above)
| Ecorse: | 49.0 |
| River Rouge: | 18.8 |
| Lincoln Park: | 28.0 |
| Melvindale: | 31.6 |
| Wyandotte: | 23.3 |
| Allen Park: | 25.0 |
| Southgate: | 18.0 |
| Riverview: | 31.4 |
| Dearborn: | 28.1 |
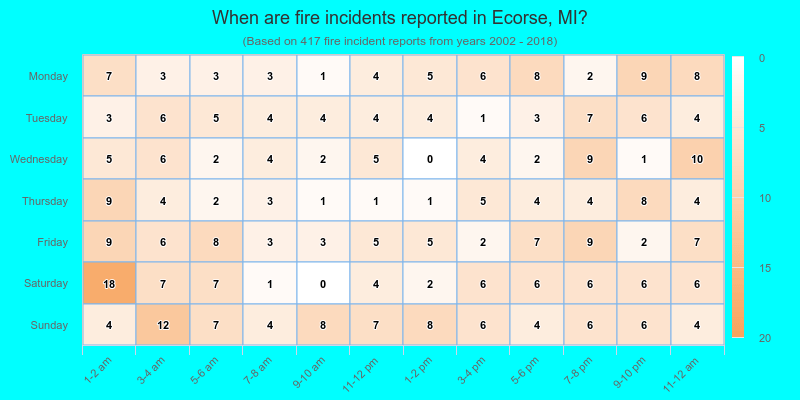
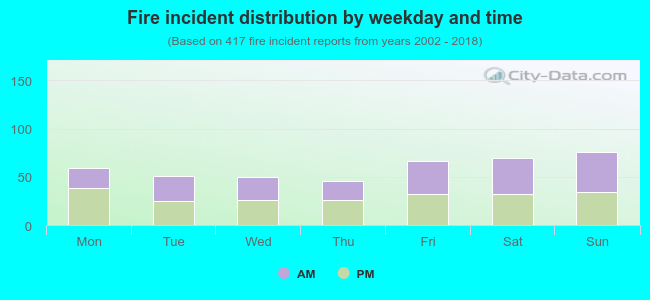 48.9% incidents where reported in the morning and 51.1% in the evening. The most fires (18.2%) took place on Sunday, and the least (11.0%) on Thursday.
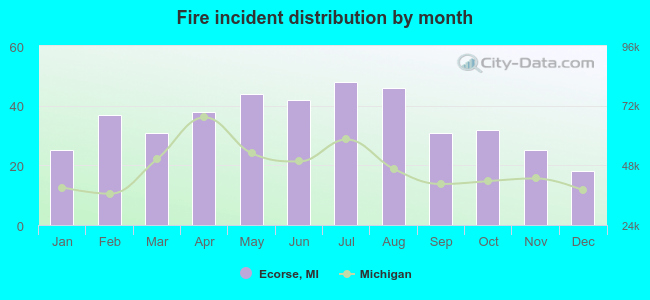 Based on the 417 fires from years 2002 - 2018 most fires (11.5%) took place during July, and the least (4.3%) in December.
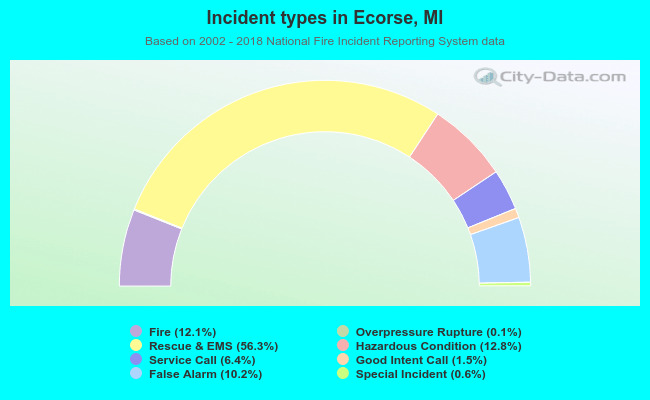 Out of all 3,447 cases reported during the years 2002 - 2018, the most belonged to the categories: Rescue & EMS (56.3%), Hazardous Condition (12.8%), and Fire (12.1%).
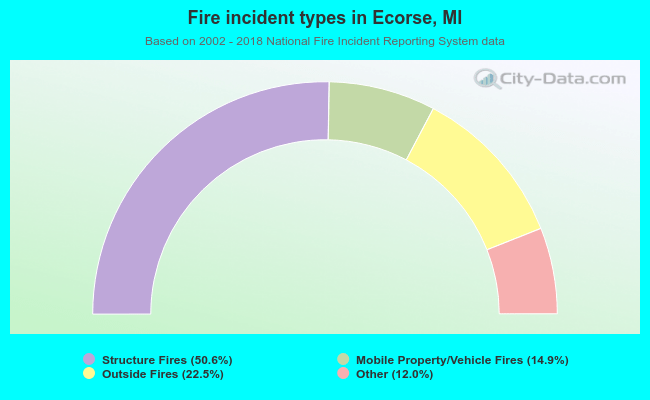 When looking into fire subcategories, the most reports belonged to: Structure Fires (50.6%), and Outside Fires (22.5%).