Rochester Hills: Fire Incidents, Michigan (MI)
Where are fire incidents reported in Rochester Hills, MI
Something went wrong! Please refresh the page.
| Fire incidents reported | |
|---|---|
| Sreet name | Count |
| ROCHESTER RD | 234 |
| AUBURN RD | 160 |
| WALTON BLVD | 146 |
| M59 | 138 |
| LIVERNOIS RD | 126 |
| ROCHESTER | 108 |
| AVON RD | 64 |
| ADAMS RD | 60 |
| CROOKS RD | 50 |
| HAMLIN RD | 48 |
| JOHN R | 48 |
| TIENKEN RD | 38 |
| PLAZA BOULEVARD | 36 |
| JOHN | 34 |
| ADAMS | 32 |
| SOUTH BLVD | 32 |
| TIENKEN | 32 |
| BARCLAY CIR | 30 |
| RIVERSIDE | 30 |
| STAR BATT DR | 30 |
| AVON | 26 |
| HAMLIN | 26 |
| LIVERNOIS | 24 |
| WOODSIDE CT | 24 |
| CROOKS | 22 |
| PLAZA BLVD | 22 |
| CLIFFVIEW DR | 20 |
| SOUTH BOULEVARD | 20 |
| BREWSTER RD | 18 |
| M59 HWY | 18 |
| Other | 471 |
2002 - 2018 National Fire Incident Reporting System (NFIRS) incidents
- Incident types reported to NFIRS in Rochester Hills, MI
- 27,22767.0%Rescue & EMS
- 3,5708.8%Service Call
- 2,7326.7%False Alarm
- 2,5206.2%Hazardous Condition
- 2,4005.9%Good Intent Call
- 2,1675.3%Fire
- Fire incident types reported to NFIRS in Rochester Hills, MI
- 1,13252.2%Structure Fires
- 61828.5%Outside Fires
- 39118.0%Mobile Property/Vehicle Fires
- 261.2%Other
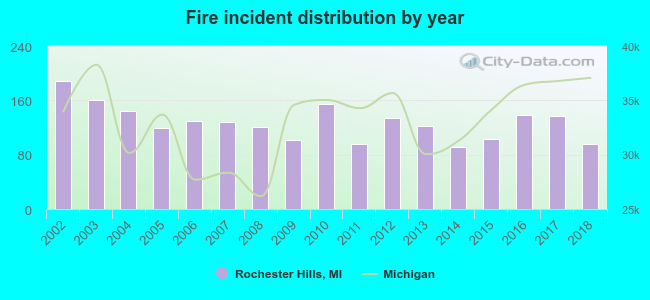 Based on the data from the years 2002 - 2018 the average number of fires per year is 127. The highest number of reported fire incidents - 189 took place in 2002, and the least - 91 in 2014. The data has a dropping trend.
The average number of yearly fire incidents per 10k residents in Rochester Hills, MI compared to nearest cities:
(Note: Based on data for the last 3 years, including only cities with population 5,000 and above)
| Rochester Hills: | 16.9 |
| Rochester: | 16.9 |
| Auburn Hills: | 44.6 |
| Troy: | 21.2 |
| Shelby: | 5.2 |
| Pontiac: | 46.2 |
| Bloomfield Township: | 0.2 |
| Birmingham: | 15.9 |
| Sterling Heights: | 18.3 |
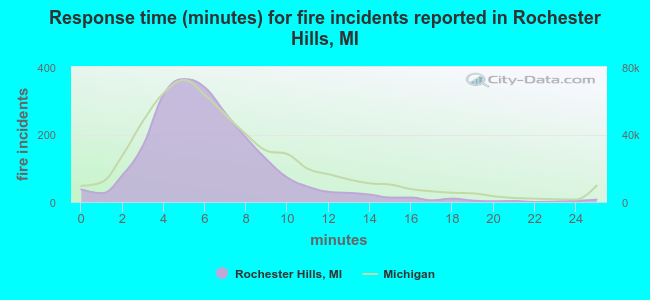 The median response time based on all reported fire incidents is 6 minutes. This is close to the Michigan median value.
The median response time in Rochester Hills, MI compared to nearest cities:
(Note: Based on data for all years, including only cities with at least 500 fire incidents)
| Rochester Hills: | 6 minutes |
| Auburn Hills: | 7 minutes |
| Troy: | 7 minutes |
| Pontiac: | 5 minutes |
| Sterling Heights: | 5 minutes |
| Lake Orion: | 5 minutes |
| Royal Oak: | 6 minutes |
| Waterford: | 5 minutes |
| Madison Heights: | 3 minutes |
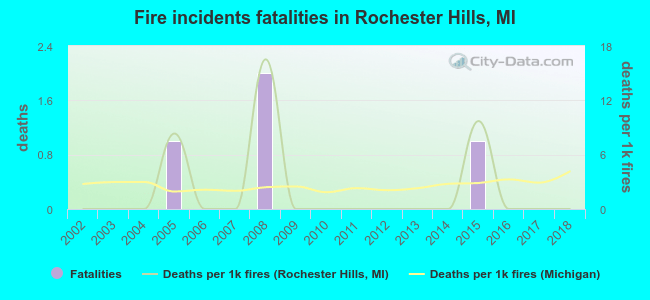 Based on the data from the years 2002 - 2018 the average number of fire-related yearly deaths is 0. The highest number of deaths - 2 took place in 2008, and the lowest - 0 in 2002. The data has a constant trend.
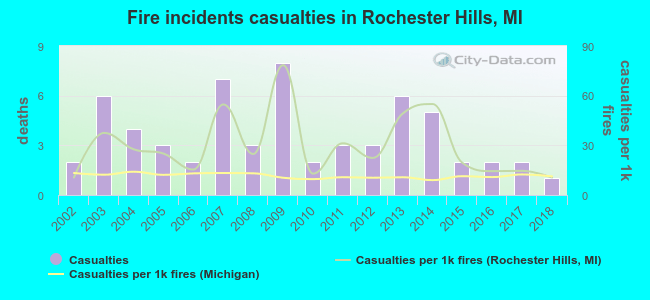 According to the data from the years 2002 - 2018 the average number of fire-related casualties per year is 4. The highest number of reported casualties - 8 took place in 2009, and the lowest - 1 in 2018. The data has a dropping trend.
The average number of injuries per 1,000 fire incidents is 30. This indicator was the highest - 78 in 2009, and the lowest 11 in 2018. The trend for casualties per 1,000 fire incidents is decreasing. Compared to the Michigan value the number of injuries per 1,000 fires is much higher.
According to the data from the years 2002 - 2018 the average number of fire-related casualties per year is 4. The highest number of reported casualties - 8 took place in 2009, and the lowest - 1 in 2018. The data has a dropping trend.
The average number of injuries per 1,000 fire incidents is 30. This indicator was the highest - 78 in 2009, and the lowest 11 in 2018. The trend for casualties per 1,000 fire incidents is decreasing. Compared to the Michigan value the number of injuries per 1,000 fires is much higher.Casualties per 1,000 incidents in Rochester Hills, MI compared to nearest cities:
(Note: Based on data for all years, including only cities with at least 500 fire incidents)
| Rochester Hills: | 28.1 |
| Auburn Hills: | 11.1 |
| Troy: | 18.0 |
| Pontiac: | 5.5 |
| Sterling Heights: | 49.4 |
| Lake Orion: | 4.6 |
| Royal Oak: | 24.1 |
| Waterford: | 24.0 |
| Madison Heights: | 10.5 |
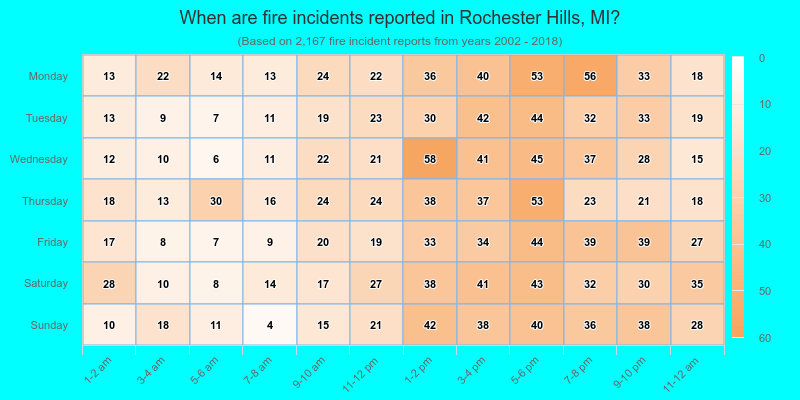
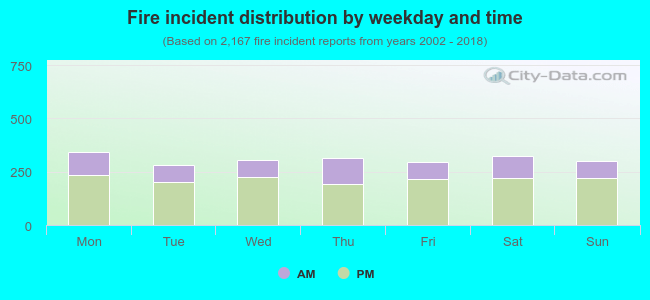 30.5% incidents where reported in the morning and 69.5% in the evening. The most fires (15.9%) took place on Monday, and the least (13.0%) on Tuesday.
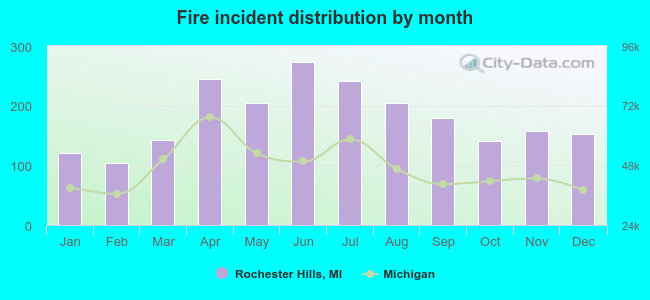 Based on the 2,167 fires from years 2002 - 2018 most fires (12.6%) took place during June, and the least (4.8%) in February.
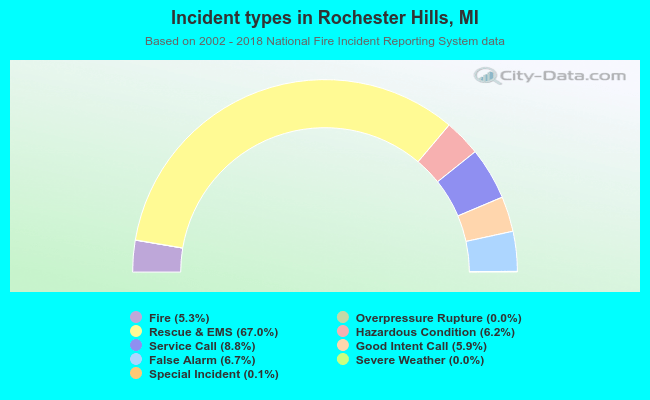 Out of all 40,650 cases reported during the years 2002 - 2018, the most belonged to the categories: Rescue & EMS (67.0%), Service Call (8.8%), and False Alarm (6.7%).
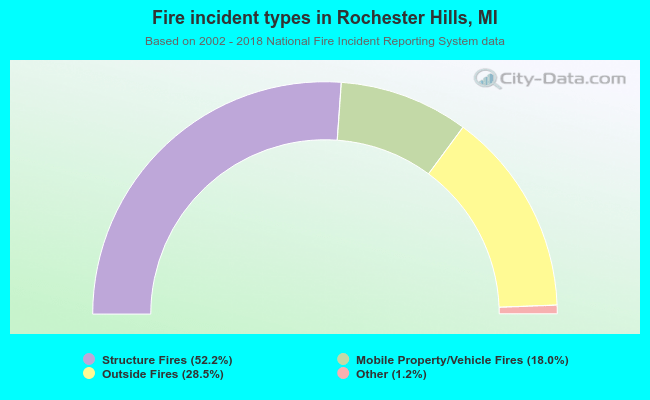 When looking into fire subcategories, the most reports belonged to: Structure Fires (52.2%), and Outside Fires (28.5%).