Royal Oak: Fire Incidents, Michigan (MI)
Where are fire incidents reported in Royal Oak, MI
Something went wrong! Please refresh the page.
| Fire incidents reported | |
|---|---|
| Sreet name | Count |
| WOODWARD AVE | 224 |
| MAIN ST | 134 |
| THIRTEEN MILE RD | 102 |
| COOLIDGE HWY | 80 |
| ELEVEN MILE RD | 72 |
| WASHINGTON AVE | 72 |
| THIRTEENMILE RD | 56 |
| ROCHESTER RD | 54 |
| CROOKS RD | 48 |
| FOURTEEN MILE RD | 46 |
| LINCOLN AVE | 46 |
| FARNUM AVE | 40 |
| TROY ST | 40 |
| FOURTH ST | 38 |
| CAMPBELL RD | 36 |
| VERMONT AVE | 36 |
| WILLIAMS ST | 36 |
| ELEVENMILE RD | 34 |
| SHERMAN DR | 32 |
| CENTER ST | 28 |
| GREENFIELD RD | 28 |
| SIXTH ST | 28 |
| TEN MILE RD | 28 |
| FOURTEENMILE RD | 26 |
| I696 | 26 |
| GARDENIA AVE | 24 |
| ALEXANDER AVE | 22 |
| BLAIR AVE | 22 |
| DEVON RD | 22 |
| ELMHURST AVE | 22 |
| Other | 198 |
2002 - 2018 National Fire Incident Reporting System (NFIRS) incidents
- Incident types reported to NFIRS in Royal Oak, MI
- 20,01660.7%Rescue & EMS
- 3,99912.1%Hazardous Condition
- 2,7118.2%Good Intent Call
- 2,3737.2%Service Call
- 1,7605.3%False Alarm
- 1,7005.2%Fire
- 3861.2%Special Incident
- Fire incident types reported to NFIRS in Royal Oak, MI
- 82648.6%Structure Fires
- 40824.0%Outside Fires
- 38722.8%Mobile Property/Vehicle Fires
- 794.6%Other
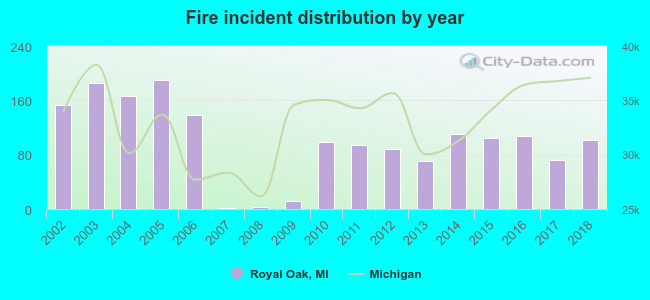 Based on the data from the years 2002 - 2018 the average number of fires per year is 100. The highest number of fire incidents - 190 took place in 2005, and the least - 2 in 2007. The data has a declining trend.
The average number of yearly fire incidents per 10k residents in Royal Oak, MI compared to nearest cities:
(Note: Based on data for the last 3 years, including only cities with population 5,000 and above)
| Royal Oak: | 15.8 |
| Huntington Woods: | 15.2 |
| Berkley: | 19.4 |
| Clawson: | 16.0 |
| Madison Heights: | 39.0 |
| Oak Park: | 30.4 |
| Ferndale: | 32.1 |
| Hazel Park: | 35.3 |
| Birmingham: | 15.9 |
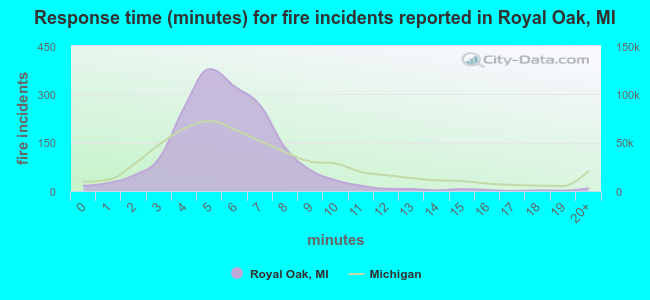 The median response time based on all reported fire incidents is 6 minutes. This is similar to the Michigan median value.
The median response time in Royal Oak, MI compared to nearest cities:
(Note: Based on data for all years, including only cities with at least 500 fire incidents)
| Royal Oak: | 6 minutes |
| Madison Heights: | 3 minutes |
| Oak Park: | 3 minutes |
| Ferndale: | 4 minutes |
| Hazel Park: | 4 minutes |
| Southfield: | 5 minutes |
| Troy: | 7 minutes |
| Warren: | 5 minutes |
| Center Line: | 3 minutes |
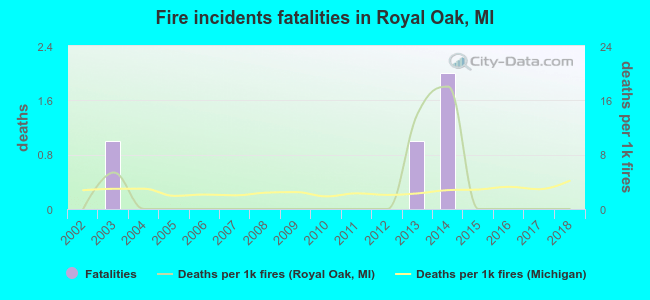 According to the data from the years 2002 - 2018 the average number of fire-related yearly deaths is 0. The highest number of deaths - 2 took place in 2014, and the lowest - 0 in 2002. The data has a constant trend.
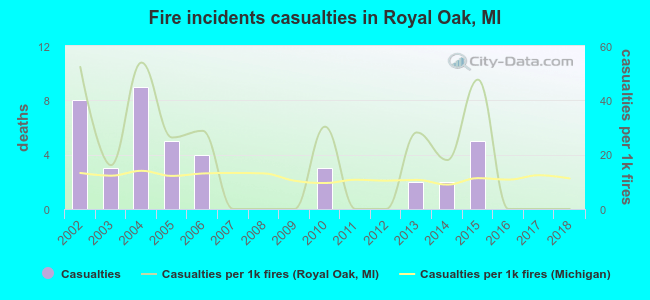 According to the reports from the years 2002 - 2018 the average number of fire-related yearly casualties is 2. The highest number of injuries - 9 took place in 2004, and the lowest - 0 in 2007. The data has a dropping trend.
The average number of injuries per 1,000 fires is 18. This indicator was the highest - 54 in 2004, and the lowest 0 in 2007. The trend for casualties per 1,000 fires is dropping. Compared to the Michigan value the number of casualties per 1,000 incidents is much higher.
According to the reports from the years 2002 - 2018 the average number of fire-related yearly casualties is 2. The highest number of injuries - 9 took place in 2004, and the lowest - 0 in 2007. The data has a dropping trend.
The average number of injuries per 1,000 fires is 18. This indicator was the highest - 54 in 2004, and the lowest 0 in 2007. The trend for casualties per 1,000 fires is dropping. Compared to the Michigan value the number of casualties per 1,000 incidents is much higher.Casualties per 1,000 incidents in Royal Oak, MI compared to nearest cities:
(Note: Based on data for all years, including only cities with at least 500 fire incidents)
| Royal Oak: | 24.1 |
| Madison Heights: | 10.5 |
| Oak Park: | 9.2 |
| Ferndale: | 33.1 |
| Hazel Park: | 21.9 |
| Southfield: | 14.3 |
| Troy: | 18.0 |
| Warren: | 24.1 |
| Center Line: | 31.9 |
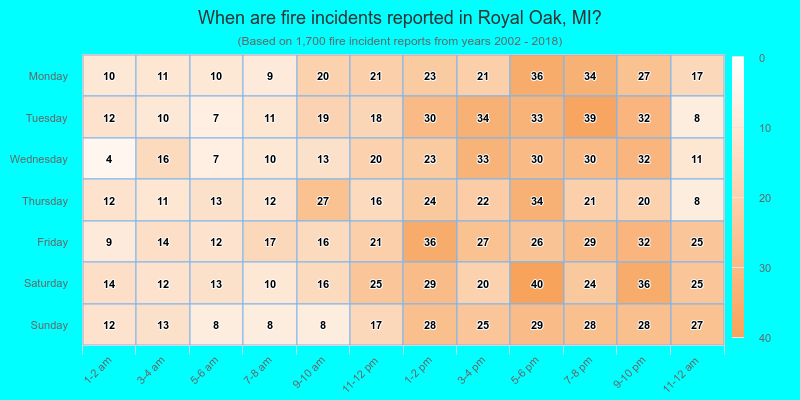
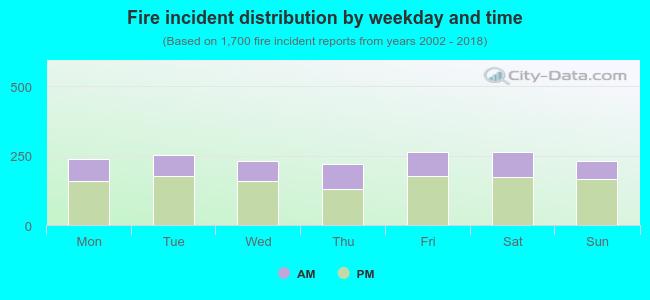 33.2% incidents where reported in the morning and 66.8% in the evening. The most fires (15.5%) took place on Friday, and the least (12.9%) on Thursday.
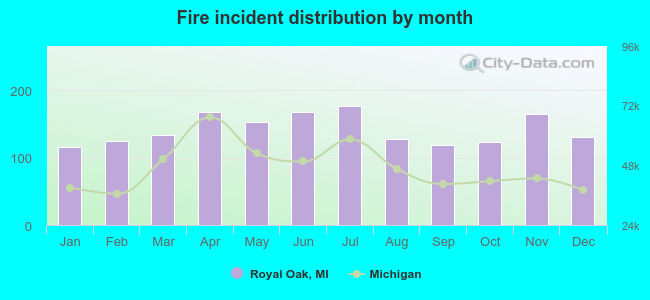 According to the 1,700 fire incidents from years 2002 - 2018 most fires (10.4%) took place during July, and the least (6.8%) in January.
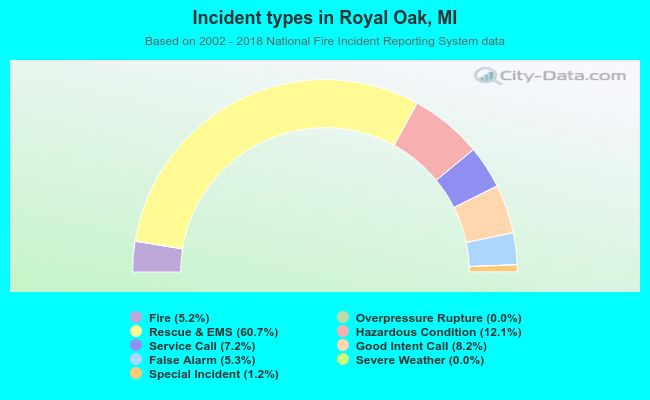 Out of all 32,953 cases reported during the years 2002 - 2018, the most belonged to the categories: Rescue & EMS (60.7%), Hazardous Condition (12.1%), and Good Intent Call (8.2%).
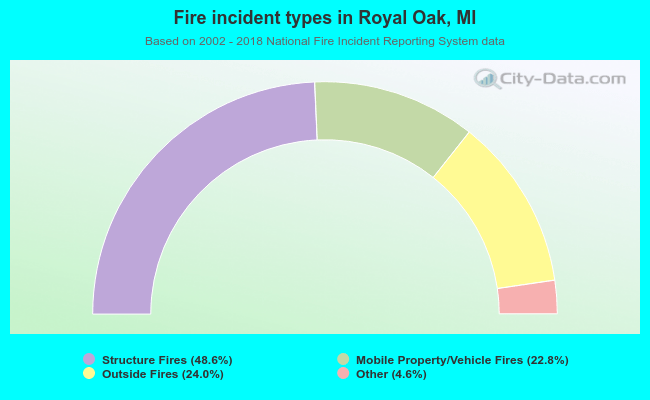 When looking into fire subcategories, the most incidents belonged to: Structure Fires (48.6%), and Outside Fires (24.0%).