Rochester: Fire Incidents, Michigan (MI)
Where are fire incidents reported in Rochester, MI
Something went wrong! Please refresh the page.
|
| |||||||||||||||||||||||||||||||||||||||||||||||||||||||||||||||||||||||||||||||||||||||||||||||||||||||||||||
2002 - 2018 National Fire Incident Reporting System (NFIRS) incidents
- Incident types reported to NFIRS in Rochester, MI
- 4,72568.9%Rescue & EMS
- 5748.4%Hazardous Condition
- 4676.8%Service Call
- 4045.9%False Alarm
- 3304.8%Good Intent Call
- 2593.8%Fire
- 911.3%Special Incident
- 90.1%Severe Weather
- Fire incident types reported to NFIRS in Rochester, MI
- 13752.9%Structure Fires
- 7127.4%Outside Fires
- 3312.7%Mobile Property/Vehicle Fires
- 186.9%Other
 Based on the data from the years 2002 - 2018 the average number of fires per year is 15. The highest number of reported fire incidents - 26 took place in 2003, and the least - 0 in 2007. The data has a growing trend.
The average number of yearly fire incidents per 10k residents in Rochester, MI compared to nearest cities:
(Note: Based on data for the last 3 years, including only cities with population 5,000 and above)
| Rochester: | 16.9 |
| Rochester Hills: | 16.9 |
| Shelby: | 5.2 |
| Auburn Hills: | 44.6 |
| Troy: | 21.2 |
| Sterling Heights: | 18.3 |
| Pontiac: | 46.2 |
| Bloomfield Township: | 0.2 |
| Clawson: | 16.0 |
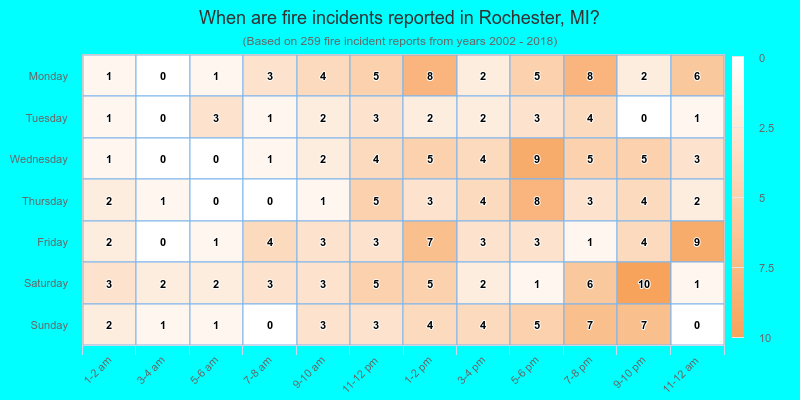
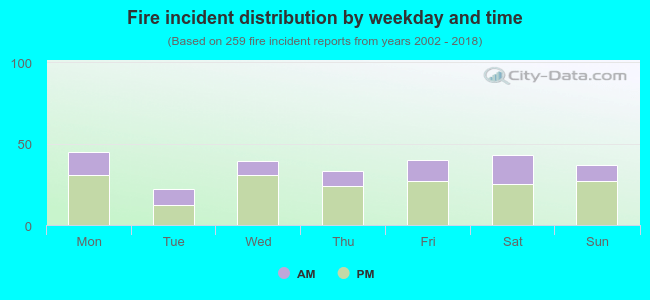 31.7% incidents where reported in the morning and 68.3% in the evening. The most fires (17.4%) took place on Monday, and the least (8.5%) on Tuesday.
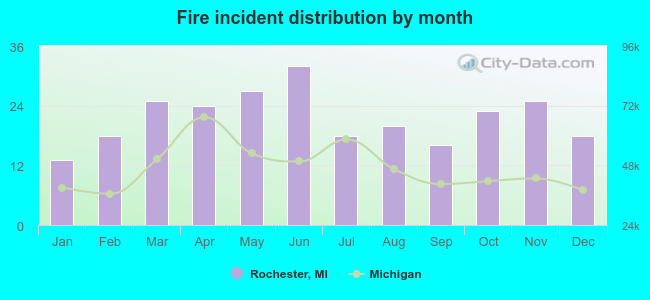 According to the 259 incident reports from years 2002 - 2018 most fires (12.4%) took place during June, and the least (5.0%) in January.
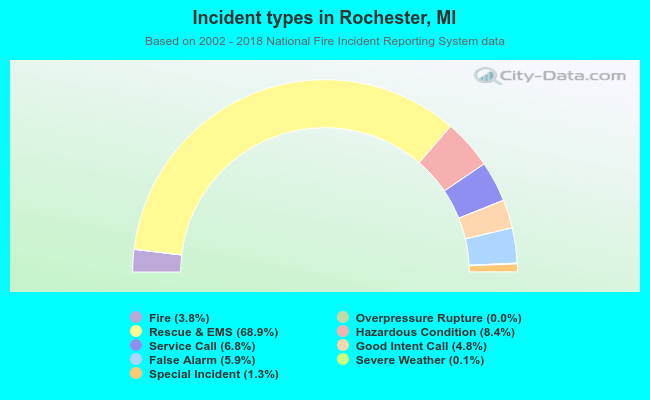 Out of all 6,861 cases reported during the years 2002 - 2018, the most belonged to the categories: Rescue & EMS (68.9%), Hazardous Condition (8.4%), and Service Call (6.8%).
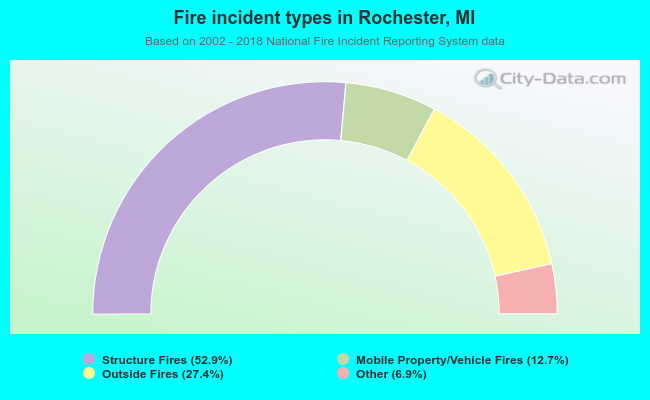 When looking into fire subcategories, the most incidents belonged to: Structure Fires (52.9%), and Outside Fires (27.4%).