Clawson: Fire Incidents, Michigan (MI)
Where are fire incidents reported in Clawson, MI
Something went wrong! Please refresh the page.
|
| |||||||||||||||||||||||||||||||||||||||||||||||||||||||||||||||||||||||||||||||||||||||||||||||||||||||||||||
2002 - 2018 National Fire Incident Reporting System (NFIRS) incidents
- Incident types reported to NFIRS in Clawson, MI
- 26138.3%Hazardous Condition
- 16323.9%Fire
- 11917.4%Good Intent Call
- 7511.0%False Alarm
- 416.0%Service Call
- 213.1%Rescue & EMS
- 20.3%Overpressure Rupture
- Fire incident types reported to NFIRS in Clawson, MI
- 8854.0%Structure Fires
- 3923.9%Outside Fires
- 2716.6%Mobile Property/Vehicle Fires
- 95.5%Other
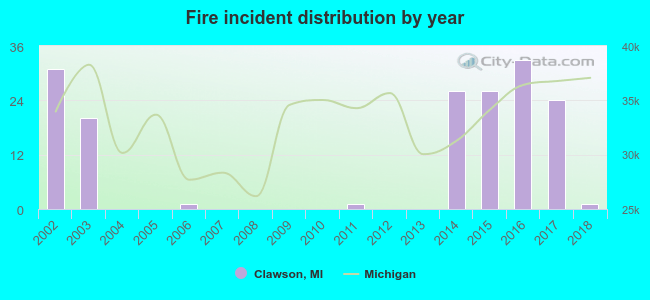 Based on the data from the years 2002 - 2018 the average number of fire incidents per year is 10. The highest number of reported fires - 33 took place in 2016, and the least - 0 in 2004. The data has a declining trend.
The average number of yearly fire incidents per 10k residents in Clawson, MI compared to nearest cities:
(Note: Based on data for the last 3 years, including only cities with population 5,000 and above)
| Clawson: | 16.0 |
| Royal Oak: | 15.8 |
| Troy: | 21.2 |
| Berkley: | 19.4 |
| Birmingham: | 15.9 |
| Madison Heights: | 39.0 |
| Huntington Woods: | 15.2 |
| Beverly Hills: | 23.9 |
| Oak Park: | 30.4 |
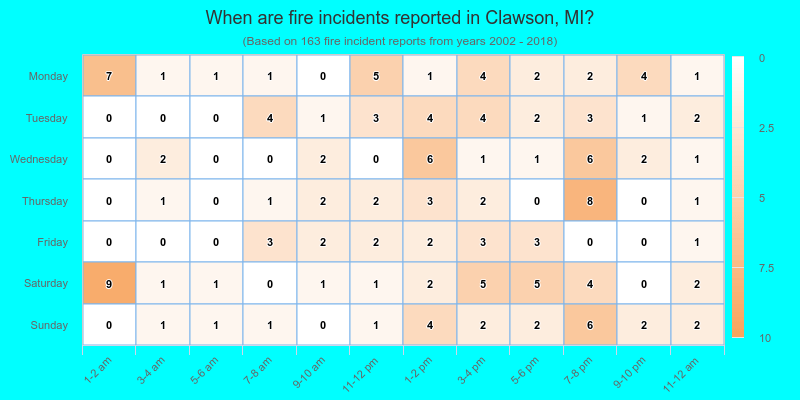
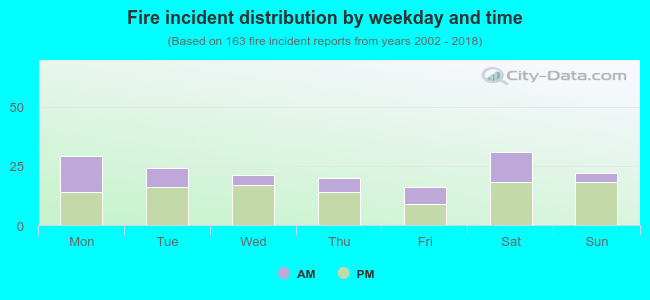 35.0% incidents where reported in the morning and 65.0% in the evening. The most fires (19.0%) took place on Saturday, and the least (9.8%) on Friday.
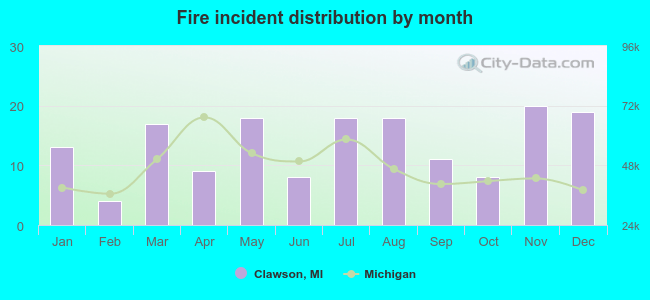 According to the 163 fires from years 2002 - 2018 most fires (12.3%) took place during November, and the least (2.5%) in February.
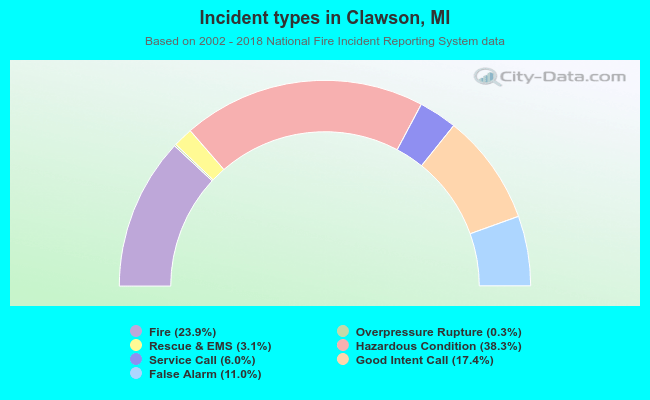 Out of all 682 cases reported during the years 2002 - 2018, the most belonged to the categories: Hazardous Condition (38.3%), Fire (23.9%), and Good Intent Call (17.4%).
 When looking into fire subcategories, the most incidents belonged to: Structure Fires (54.0%), and Outside Fires (23.9%).