Rochester: Fire Incidents, New Hampshire (NH)
Where are fire incidents reported in Rochester, NH
Something went wrong! Please refresh the page.
| Fire incidents reported | |
|---|---|
| Sreet name | Count |
| NORTH MAIN ST | 128 |
| FARMINGTON RD | 82 |
| SPAULDING TPKE | 80 |
| LAFAYETTE ST | 76 |
| SOUTH MAIN ST | 76 |
| WAKEFIELD ST | 74 |
| CHESTNUT HILL RD | 64 |
| OLD DOVER RD | 52 |
| PORTLAND ST | 52 |
| ROCHESTER HILL RD | 50 |
| WHITEHOUSE RD | 42 |
| LOWELL ST | 38 |
| DOMINICUS CT | 36 |
| CHARLES ST | 34 |
| COLUMBUS AVE | 34 |
| CHESTNUT ST | 32 |
| FOUR ROD RD | 30 |
| MILTON RD | 30 |
| WINTER ST | 30 |
| PINE ST | 28 |
| TEN ROD RD | 28 |
| LILAC MALL | 26 |
| GRANITE ST | 24 |
| WHITEHALL RD | 24 |
| ACADEMY ST | 22 |
| BROCK ST | 20 |
| EASTERN AVE | 20 |
| FRANKLIN ST | 18 |
| BRIDGE ST | 16 |
| MAIN ST | 16 |
2003 - 2018 National Fire Incident Reporting System (NFIRS) incidents
- Incident types reported to NFIRS in Rochester, NH
- 3,73932.0%Rescue & EMS
- 3,08426.4%Hazardous Condition
- 1,43712.3%Service Call
- 1,22210.4%Good Intent Call
- 1,0869.3%False Alarm
- 1,0749.2%Fire
- 290.2%Special Incident
- 200.2%Severe Weather
- Fire incident types reported to NFIRS in Rochester, NH
- 47243.9%Structure Fires
- 38635.9%Outside Fires
- 15614.5%Mobile Property/Vehicle Fires
- 605.6%Other
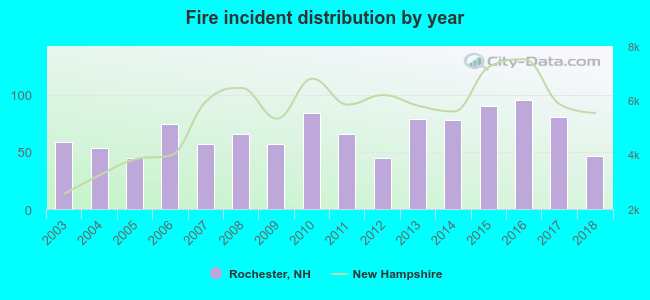 According to the data from the years 2003 - 2018 the average number of fire incidents per year is 67. The highest number of reported fire incidents - 95 took place in 2016, and the least - 45 in 2005. The data has a decreasing trend.
The average number of yearly fire incidents per 10k residents in Rochester, NH compared to nearest cities:
(Note: Based on data for the last 3 years, including only cities with population 5,000 and above)
| Rochester: | 24.6 |
| Somersworth: | 36.5 |
| Barrington: | 30.3 |
| Dover: | 27.6 |
| Durham: | 42.2 |
| Newmarket: | 32.1 |
| Alton: | 78.7 |
| Portsmouth: | 34.1 |
| Stratham: | 53.3 |
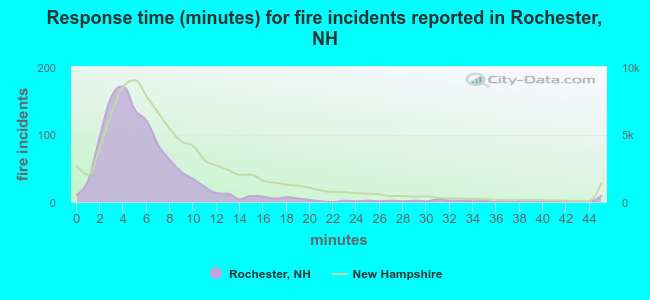 The median response time based on all reported fire incidents is 5 minutes. This is lower compared to the state median value.
The median response time in Rochester, NH compared to nearest cities:
(Note: Based on data for all years, including only cities with at least 500 fire incidents)
| Rochester: | 5 minutes |
| Somersworth: | 4 minutes |
| Farmington: | 7 minutes |
| Dover: | 5 minutes |
| Durham: | 4 minutes |
| Sanford: | 4 minutes |
| Pittsfield: | 10 minutes |
| Wells: | 7 minutes |
| Alton: | 14 minutes |
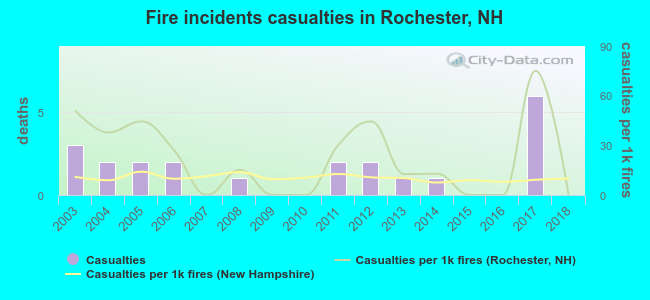 According to the data from the years 2003 - 2018 the average number of fire-related yearly casualties is 1. The highest number of injuries - 6 took place in 2017, and the lowest - 0 in 2007. The data has a declining trend.
The average number of injuries per 1,000 fire incidents is 22. This indicator was the highest - 75 in 2017, and the lowest 0 in 2007. The trend for injuries per 1,000 fires is dropping. Compared to the state value the number of casualties per 1,000 fires is higher.
According to the data from the years 2003 - 2018 the average number of fire-related yearly casualties is 1. The highest number of injuries - 6 took place in 2017, and the lowest - 0 in 2007. The data has a declining trend.
The average number of injuries per 1,000 fire incidents is 22. This indicator was the highest - 75 in 2017, and the lowest 0 in 2007. The trend for injuries per 1,000 fires is dropping. Compared to the state value the number of casualties per 1,000 fires is higher.Casualties per 1,000 incidents in Rochester, NH compared to nearest cities:
(Note: Based on data for all years, including only cities with at least 500 fire incidents)
| Rochester: | 20.5 |
| Somersworth: | 3.9 |
| Farmington: | 1.2 |
| Dover: | 17.4 |
| Durham: | 8.4 |
| Sanford: | 19.5 |
| Pittsfield: | 22.3 |
| Wells: | 14.2 |
| Alton: | 1.5 |
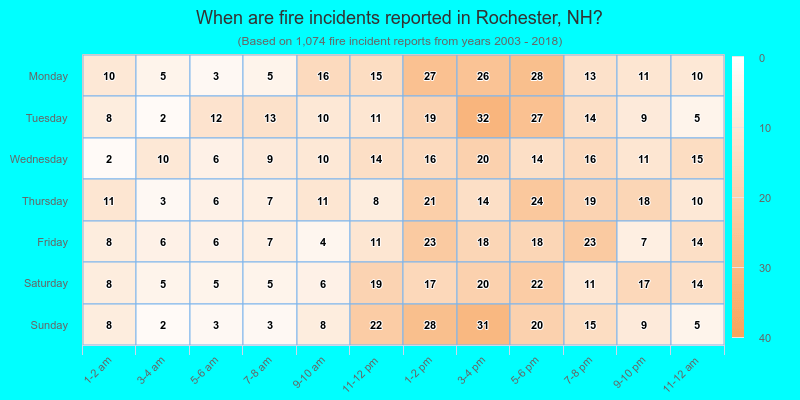
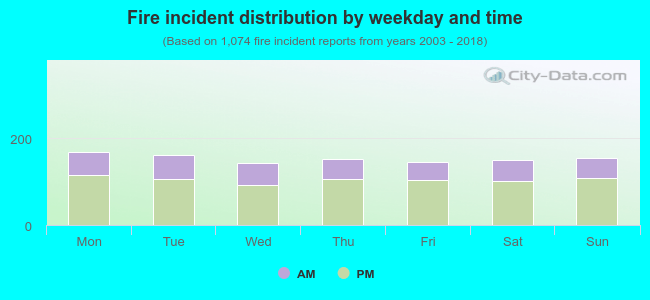 31.9% incidents where reported in the morning and 68.1% in the evening. The most fires (15.7%) took place on Monday, and the least (13.3%) on Wednesday.
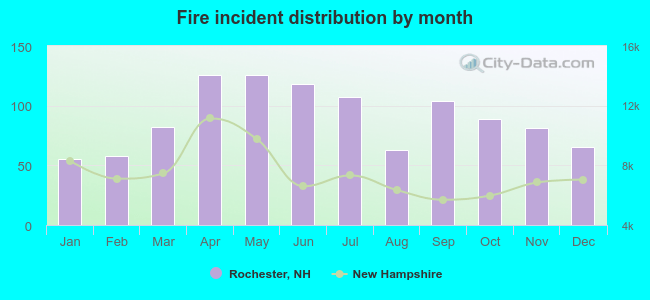 According to the 1,074 reports from years 2003 - 2018 most fires (11.7%) took place during April, and the least (5.1%) in January.
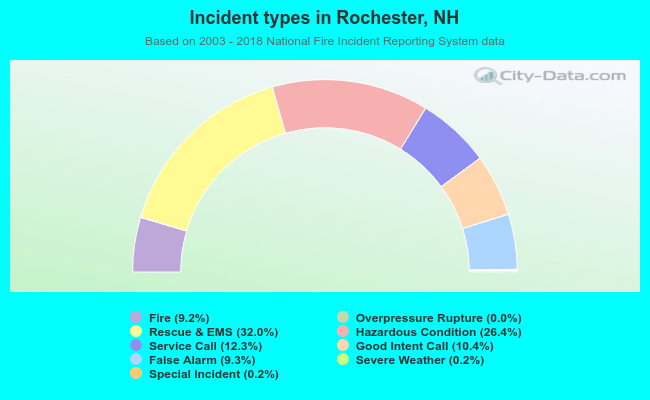 Out of all 11,695 cases reported during the years 2003 - 2018, the most belonged to the categories: Rescue & EMS (32.0%), Hazardous Condition (26.4%), and Service Call (12.3%).
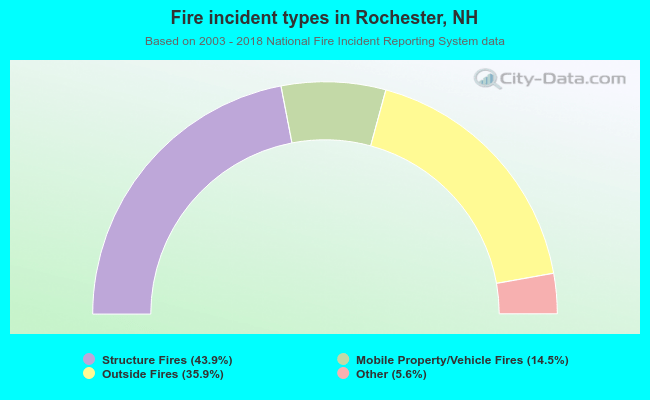 When looking into fire subcategories, the most reports belonged to: Structure Fires (43.9%), and Outside Fires (35.9%).