Stratham: Fire Incidents, New Hampshire (NH)
Where are fire incidents reported in Stratham, NH
Something went wrong! Please refresh the page.
|
| |||||||||||||||||||||||||||||||||||||||||||||||||||||||||||||||||||||||||||||||||||||||||||||||||||||||||||||
2002 - 2018 National Fire Incident Reporting System (NFIRS) incidents
- Incident types reported to NFIRS in Stratham, NH
- 1,85660.5%Rescue & EMS
- 44614.5%False Alarm
- 3059.9%Fire
- 1916.2%Hazardous Condition
- 1334.3%Service Call
- 1143.7%Good Intent Call
- 80.3%Overpressure Rupture
- 80.3%Severe Weather
- 50.2%Special Incident
- Fire incident types reported to NFIRS in Stratham, NH
- 13644.6%Structure Fires
- 9932.5%Outside Fires
- 4514.8%Other
- 258.2%Mobile Property/Vehicle Fires
 According to the data from the years 2002 - 2018 the average number of fires per year is 18. The highest number of reported fire incidents - 40 took place in 2016, and the least - 1 in 2005. The data has an increasing trend.
The average number of yearly fire incidents per 10k residents in Stratham, NH compared to nearest cities:
(Note: Based on data for the last 3 years, including only cities with population 5,000 and above)
| Stratham: | 53.3 |
| Exeter: | 59.2 |
| Newmarket: | 32.1 |
| Hampton: | 65.2 |
| Rye: | 37.8 |
| Portsmouth: | 34.1 |
| Durham: | 42.2 |
| Seabrook: | 62.1 |
| Kingston: | 52.6 |
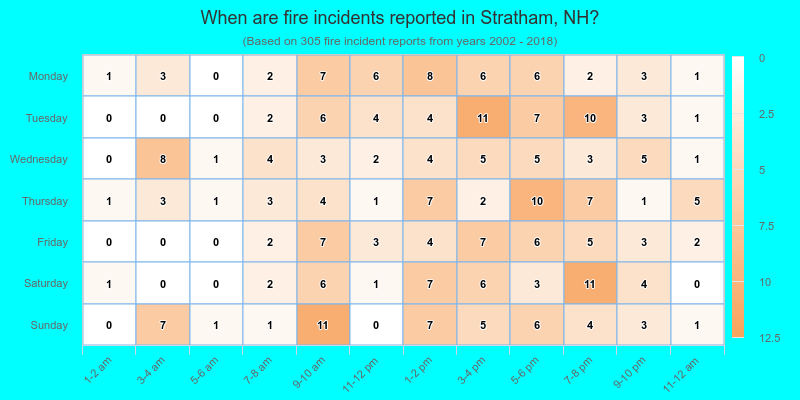
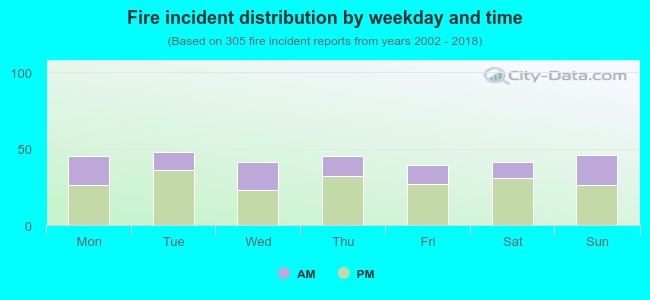 34.1% incidents where reported in the morning and 65.9% in the evening. The most fires (15.7%) took place on Tuesday, and the least (12.8%) on Friday.
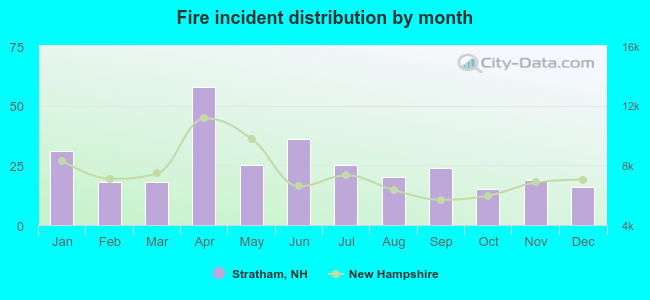 Based on the 305 fire incident reports from years 2002 - 2018 most fires (19.0%) took place during April, and the least (4.9%) in October.
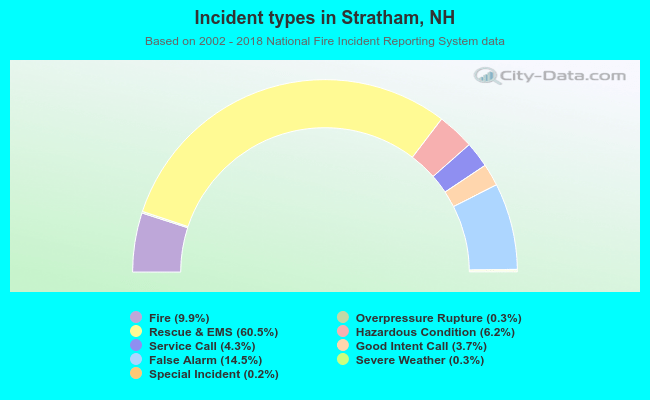 Out of all 3,066 cases reported during the years 2002 - 2018, the most belonged to the categories: Rescue & EMS (60.5%), False Alarm (14.5%), and Fire (9.9%).
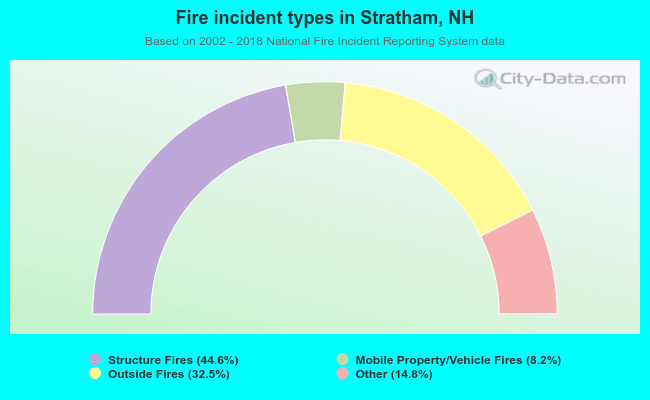 When looking into fire subcategories, the most incidents belonged to: Structure Fires (44.6%), and Outside Fires (32.5%).