Durham: Fire Incidents, New Hampshire (NH)
Where are fire incidents reported in Durham, NH
Something went wrong! Please refresh the page.
| Fire incidents reported | |
|---|---|
| Sreet name | Count |
| MAIN ST | 230 |
| MADBURY RD | 116 |
| GARRISON AVE | 78 |
| STRAFFORD AVE | 64 |
| COLLEGE RD | 56 |
| YOUNG DR | 52 |
| DEMERITT CIR | 48 |
| MILL RD | 38 |
| GABLES WAY | 36 |
| NEWMARKET RD | 36 |
| MCDANIEL DR | 34 |
| MAST RD | 32 |
| DURHAM POINT RD | 30 |
| BALLARD ST | 28 |
| QUAD WAY | 28 |
| EVERGREEN DR | 22 |
| WOODMAN RD | 22 |
| COE DR | 20 |
| DOVER RD | 20 |
| MUTUAL AID GIVEN | 20 |
| ACADEMIC WAY | 18 |
| DAME RD | 18 |
| LIBRARY WAY | 18 |
| PACKERS FALLS RD | 18 |
| PISCATAQUA RD | 16 |
| LONGMARSH RD | 14 |
| STAGECOACH RD | 14 |
| JENKINS CT | 12 |
| SMITH PARK LN | 12 |
| WILLIAMSON DR | 12 |
2002 - 2018 National Fire Incident Reporting System (NFIRS) incidents
- Incident types reported to NFIRS in Durham, NH
- 5,91836.1%Rescue & EMS
- 4,60828.1%Service Call
- 3,07218.8%False Alarm
- 1,3248.1%Hazardous Condition
- 8365.1%Fire
- 5823.6%Good Intent Call
- 300.2%Severe Weather
- Fire incident types reported to NFIRS in Durham, NH
- 40548.4%Structure Fires
- 34941.7%Outside Fires
- 516.1%Mobile Property/Vehicle Fires
- 313.7%Other
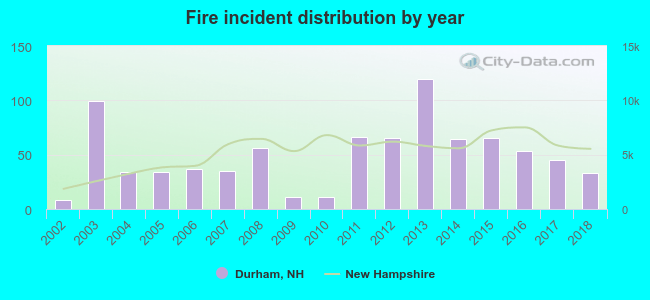 According to the data from the years 2002 - 2018 the average number of fire incidents per year is 49. The highest number of reported fire incidents - 120 took place in 2013, and the least - 8 in 2002. The data has a rising trend.
The average number of yearly fire incidents per 10k residents in Durham, NH compared to nearest cities:
(Note: Based on data for the last 3 years, including only cities with population 5,000 and above)
| Durham: | 42.2 |
| Newmarket: | 32.1 |
| Dover: | 27.6 |
| Barrington: | 30.3 |
| Somersworth: | 36.5 |
| Stratham: | 53.3 |
| Portsmouth: | 34.1 |
| Exeter: | 59.2 |
| Rochester: | 24.6 |
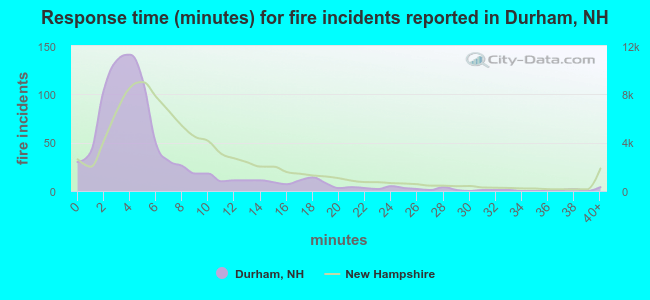 The median response time based on all reported fire incidents is 4 minutes. This is lower than the New Hampshire median value.
The median response time in Durham, NH compared to nearest cities:
(Note: Based on data for all years, including only cities with at least 500 fire incidents)
| Durham: | 4 minutes |
| Dover: | 5 minutes |
| Somersworth: | 4 minutes |
| Portsmouth: | 6 minutes |
| Epping: | 9 minutes |
| Exeter: | 6 minutes |
| Rochester: | 5 minutes |
| Hampton: | 5 minutes |
| Raymond: | 8 minutes |
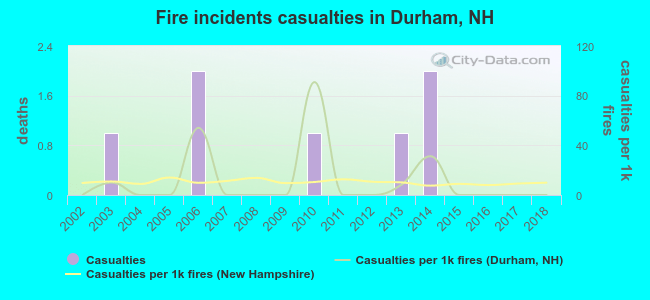 According to the data from the years 2002 - 2018 the average number of fire-related yearly casualties is 0. The highest number of reported casualties - 2 took place in 2006, and the lowest - 0 in 2002. The data has a constant trend.
The average number of casualties per 1,000 fire incidents is 11. This indicator was the highest - 91 in 2010, and the lowest 0 in 2002. The trend for injuries per 1,000 fire incidents is constant. Compared to the New Hampshire value the number of casualties per 1,000 fires is lower.
According to the data from the years 2002 - 2018 the average number of fire-related yearly casualties is 0. The highest number of reported casualties - 2 took place in 2006, and the lowest - 0 in 2002. The data has a constant trend.
The average number of casualties per 1,000 fire incidents is 11. This indicator was the highest - 91 in 2010, and the lowest 0 in 2002. The trend for injuries per 1,000 fire incidents is constant. Compared to the New Hampshire value the number of casualties per 1,000 fires is lower.Casualties per 1,000 incidents in Durham, NH compared to nearest cities:
(Note: Based on data for all years, including only cities with at least 500 fire incidents)
| Durham: | 8.4 |
| Dover: | 17.4 |
| Somersworth: | 3.9 |
| Portsmouth: | 12.7 |
| Epping: | 11.9 |
| Exeter: | 2.3 |
| Rochester: | 20.5 |
| Hampton: | 5.0 |
| Raymond: | 28.5 |
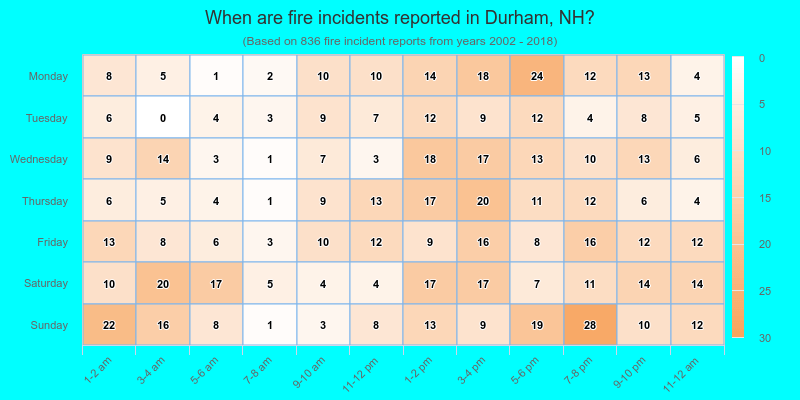
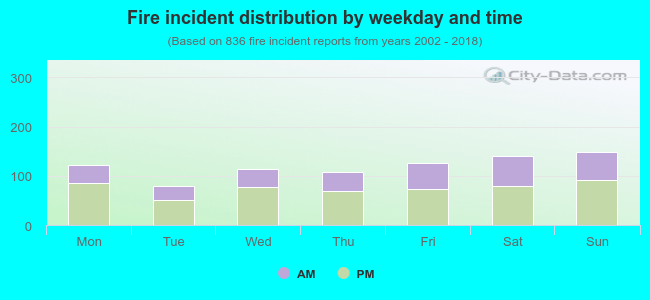 37.1% incidents where reported in the morning and 62.9% in the evening. The most fires (17.8%) took place on Sunday, and the least (9.4%) on Tuesday.
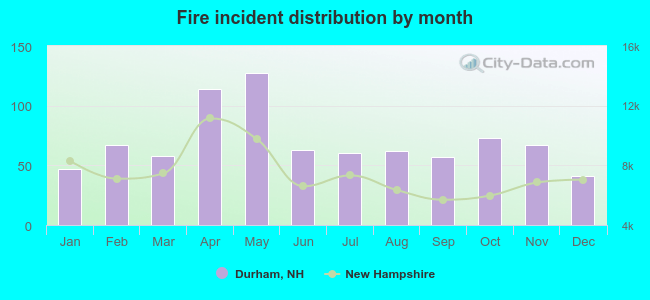 According to the 836 fire incident reports from years 2002 - 2018 most fires (15.2%) took place during May, and the least (4.9%) in December.
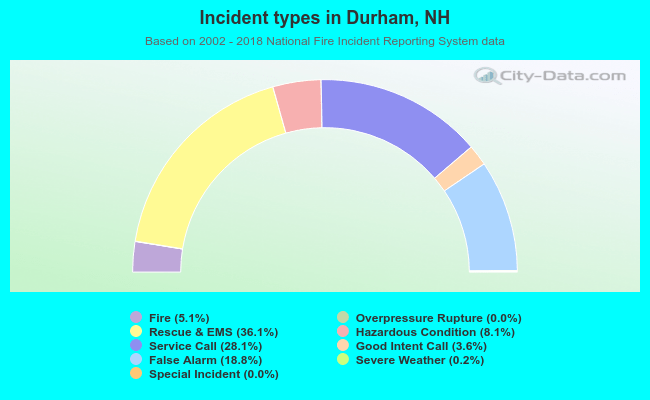 Out of all 16,382 cases reported during the years 2002 - 2018, the most belonged to the categories: Rescue & EMS (36.1%), Service Call (28.1%), and False Alarm (18.8%).
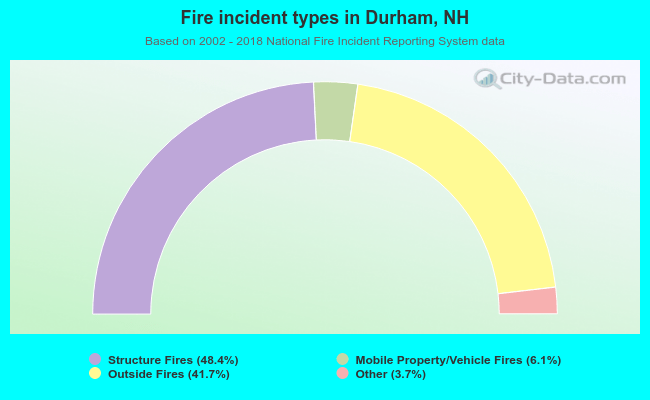 When looking into fire subcategories, the most reports belonged to: Structure Fires (48.4%), and Outside Fires (41.7%).