Salem: Fire Incidents, Ohio (OH)
Where are fire incidents reported in Salem, OH
Something went wrong! Please refresh the page.
| Fire incidents reported | |
|---|---|
| Sreet name | Count |
| STATE ST | 206 |
| LINCOLN AVE | 118 |
| PERSHING ST | 80 |
| ELLSWORTH AVE | 72 |
| PINE LAKE RD | 60 |
| W SOUTH RANGE RD | 54 |
| NEWGARDEN AVE | 52 |
| PROSPECT ST | 52 |
| BENTON RD | 48 |
| BROADWAY AVE | 42 |
| THIRD ST | 42 |
| WILSON ST | 42 |
| FOURTH ST | 40 |
| GOSHEN RD | 40 |
| PERRY ST | 40 |
| GEORGETOWN RD | 38 |
| ALLIANCE SALEM RD | 34 |
| FRANKLIN AVE | 34 |
| SALEMUNITY RD | 34 |
| DEPOT RD | 32 |
| EGYPT RD | 32 |
| WESTERN RESERVE RD | 32 |
| WOODLAND AVE | 32 |
| JENNINGS AVE | 30 |
| PIDGEON RD | 30 |
| ROUTE 62 | 30 |
| W PINE LAKE RD | 30 |
| FIFTH ST | 26 |
| LISBON-CANFIELD RD | 26 |
| SALEM-UNITY RD | 26 |
| Other | 363 |
2002 - 2018 National Fire Incident Reporting System (NFIRS) incidents
- Incident types reported to NFIRS in Salem, OH
- 6,08043.1%Rescue & EMS
- 2,74319.5%Hazardous Condition
- 1,81712.9%Fire
- 1,80512.8%Service Call
- 7805.5%Good Intent Call
- 6584.7%False Alarm
- 1310.9%Severe Weather
- 420.3%Overpressure Rupture
- 420.3%Special Incident
- Fire incident types reported to NFIRS in Salem, OH
- 86747.7%Structure Fires
- 72439.8%Outside Fires
- 21111.6%Mobile Property/Vehicle Fires
- 150.8%Other
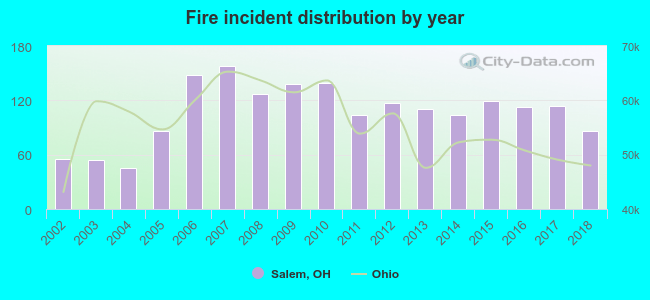 Based on the data from the years 2002 - 2018 the average number of fires per year is 107. The highest number of reported fire incidents - 158 took place in 2007, and the least - 45 in 2004. The data has a growing trend.
The average number of yearly fire incidents per 10k residents in Salem, OH compared to nearest cities:
(Note: Based on data for the last 3 years, including only cities with population 5,000 and above)
| Salem: | 86.3 |
| Columbiana: | 40.0 |
| Canfield: | 35.6 |
| Alliance: | 60.8 |
| Boardman: | 20.4 |
| Austintown: | 36.3 |
| Struthers: | 33.2 |
| Youngstown: | 89.8 |
| Campbell: | 88.4 |
 The median response time based on all reported fire incidents is 7 minutes. This is close to the Ohio median value.
The median response time in Salem, OH compared to nearest cities:
(Note: Based on data for all years, including only cities with at least 500 fire incidents)
| Salem: | 7 minutes |
| Lisbon: | 10 minutes |
| Canfield: | 6 minutes |
| Alliance: | 4 minutes |
| Boardman: | 4 minutes |
| Austintown: | 5 minutes |
| East Palestine: | 7 minutes |
| Struthers: | 3 minutes |
| Youngstown: | 3 minutes |
 According to the reports from the years 2002 - 2018 the average number of fire-related yearly deaths is 0. The highest number of deaths - 1 took place in 2008, and the lowest - 0 in 2002. The data has a constant trend.
 According to the data from the years 2002 - 2018 the average number of fire-related casualties per year is 0. The highest number of casualties - 1 took place in 2004, and the lowest - 0 in 2002. The data has a constant trend.
The average number of casualties per 1,000 fire incidents is 4. This indicator was the highest - 22 in 2004, and the lowest 0 in 2002. The trend for injuries per 1,000 fires is constant. Compared to the Ohio value the number of injuries per 1,000 fires is much lower.
According to the data from the years 2002 - 2018 the average number of fire-related casualties per year is 0. The highest number of casualties - 1 took place in 2004, and the lowest - 0 in 2002. The data has a constant trend.
The average number of casualties per 1,000 fire incidents is 4. This indicator was the highest - 22 in 2004, and the lowest 0 in 2002. The trend for injuries per 1,000 fires is constant. Compared to the Ohio value the number of injuries per 1,000 fires is much lower.Casualties per 1,000 incidents in Salem, OH compared to nearest cities:
(Note: Based on data for all years, including only cities with at least 500 fire incidents)
| Salem: | 3.3 |
| Lisbon: | 5.6 |
| Canfield: | 38.0 |
| Alliance: | 18.0 |
| Boardman: | 52.1 |
| Austintown: | 40.8 |
| East Palestine: | 18.3 |
| Struthers: | 21.8 |
| Youngstown: | 11.1 |
 30.3% incidents where reported in the morning and 69.7% in the evening. The most fires (15.7%) took place on Friday, and the least (12.4%) on Wednesday.
 Based on the 1,817 fire incident reports from years 2002 - 2018 most fires (13.1%) took place during April, and the least (5.2%) in February.
 Out of all 14,098 cases reported during the years 2002 - 2018, the most belonged to the categories: Rescue & EMS (43.1%), Hazardous Condition (19.5%), and Fire (12.9%).
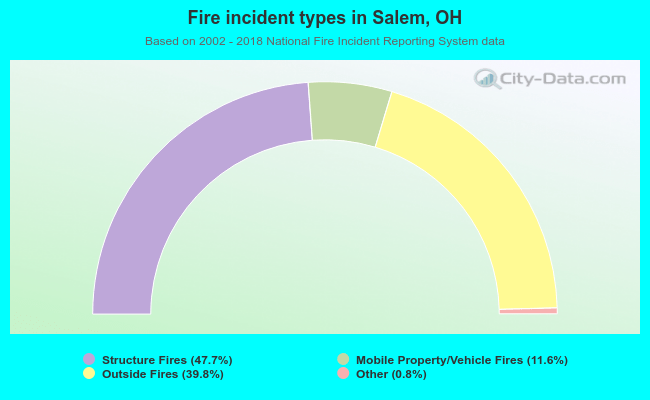 When looking into fire subcategories, the most reports belonged to: Structure Fires (47.7%), and Outside Fires (39.8%).