Sanford: Fire Incidents, North Carolina (NC)
Where are fire incidents reported in Sanford, NC
Something went wrong! Please refresh the page.
| Fire incidents reported | |
|---|---|
| Sreet name | Count |
| HORNER BLVD | 338 |
| JEFFERSON DAVIS HWY | 316 |
| SHERIFF WATSON RD | 192 |
| BROADWAY RD | 156 |
| CARBONTON RD | 136 |
| PLANK RD | 134 |
| CARTHAGE ST | 128 |
| EDWARDS RD | 126 |
| HAWKINS AVE | 120 |
| NC 87 | 120 |
| NC 87 HWY | 118 |
| BARBECUE CHURCH RD | 116 |
| DEEP RIVER RD | 102 |
| TRAMWAY RD | 96 |
| LOWER MONCURE RD | 94 |
| MCDOUGALD RD | 94 |
| BUCKHORN RD | 92 |
| COLON RD | 92 |
| SAINT ANDREWS CHURCH RD | 92 |
| LEE AVE | 90 |
| BOONE TRAIL RD | 86 |
| BUFFALO LAKE RD | 86 |
| FARRELL RD | 86 |
| LEMON SPRINGS RD | 86 |
| MAIN ST | 86 |
| NICHOLSON RD | 86 |
| MINTER SCHOOL RD | 84 |
| NICOLE DR | 80 |
| OLIVIA RD | 78 |
| PILSON RD | 72 |
| Other | 4,029 |
2002 - 2018 National Fire Incident Reporting System (NFIRS) incidents
- Incident types reported to NFIRS in Sanford, NC
- 7,61127.7%Fire
- 7,48127.2%Hazardous Condition
- 4,45516.2%Rescue & EMS
- 3,03411.0%Good Intent Call
- 2,97810.8%False Alarm
- 1,3524.9%Service Call
- 4231.5%Severe Weather
- 890.3%Overpressure Rupture
- 750.3%Special Incident
- Fire incident types reported to NFIRS in Sanford, NC
- 3,15741.5%Structure Fires
- 3,09040.6%Outside Fires
- 1,02413.5%Mobile Property/Vehicle Fires
- 3404.5%Other
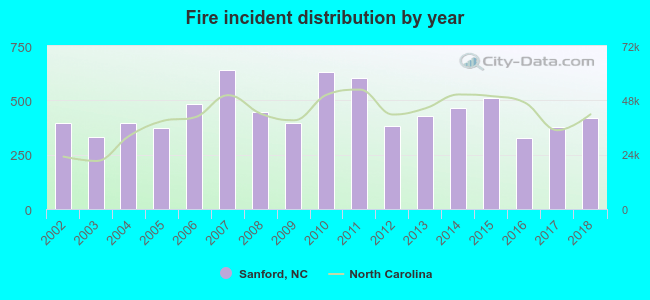 Based on the data from the years 2002 - 2018 the average number of fire incidents per year is 448. The highest number of fires - 640 took place in 2007, and the least - 325 in 2016. The data has a rising trend.
The average number of yearly fire incidents per 10k residents in Sanford, NC compared to nearest cities:
(Note: Based on data for the last 3 years, including only cities with population 5,000 and above)
| Sanford: | 128.7 |
| Holly Springs: | 24.0 |
| Spring Lake: | 144.1 |
| Siler City: | 108.4 |
| Southern Pines: | 88.4 |
| Pinehurst: | 47.3 |
| Fort Bragg: | 0.3 |
| Apex: | 26.2 |
| Aberdeen: | 178.1 |
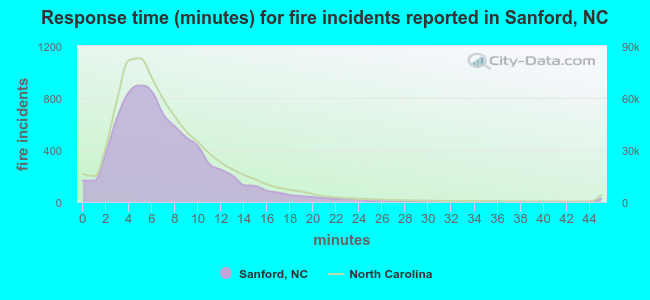 The median response time based on all reported fire incidents is 6 minutes. This is similar to the North Carolina median value.
The median response time in Sanford, NC compared to nearest cities:
(Note: Based on data for all years, including only cities with at least 500 fire incidents)
| Sanford: | 6 minutes |
| Broadway: | 10 minutes |
| Cameron: | 8 minutes |
| Vass: | 7 minutes |
| Carthage: | 9 minutes |
| Pittsboro: | 8 minutes |
| Lillington: | 9 minutes |
| Robbins: | 9 minutes |
| Fuquay-Varina: | 5 minutes |
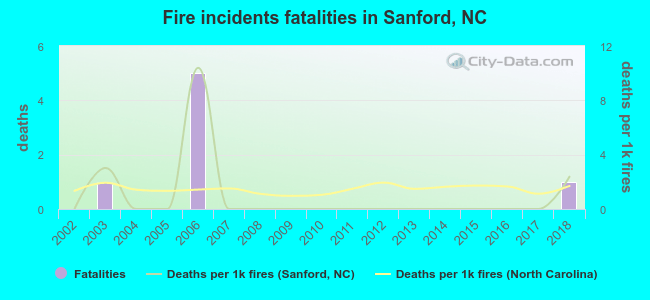 According to the data from the years 2002 - 2018 the average number of fire-related fatalities per year is 0. The highest number of deaths - 5 took place in 2006, and the lowest - 0 in 2002. The data has a rising trend.
The average number of fatalities per 1,000 fire incidents is 1. This indicator was the highest - 10 in 2006, and the lowest 0 in 2002. The trend for deaths per 1,000 incidents is growing. Compared to the North Carolina value the number of deaths per 1,000 incidents is lower.
According to the data from the years 2002 - 2018 the average number of fire-related fatalities per year is 0. The highest number of deaths - 5 took place in 2006, and the lowest - 0 in 2002. The data has a rising trend.
The average number of fatalities per 1,000 fire incidents is 1. This indicator was the highest - 10 in 2006, and the lowest 0 in 2002. The trend for deaths per 1,000 incidents is growing. Compared to the North Carolina value the number of deaths per 1,000 incidents is lower.Deaths per 1,000 incidents in Sanford, NC compared to nearest cities:
(Note: Based on data for all years, including only cities with at least 2,500 fire incidents)
| Sanford: | 0.9 |
| Cameron: | 0.3 |
| Lillington: | 2.1 |
| Spring Lake: | 0.8 |
| Cary: | 1.1 |
| Fayetteville: | 1.0 |
| Chapel Hill: | 0.5 |
| Dunn: | 1.5 |
| Raeford: | 0.0 |
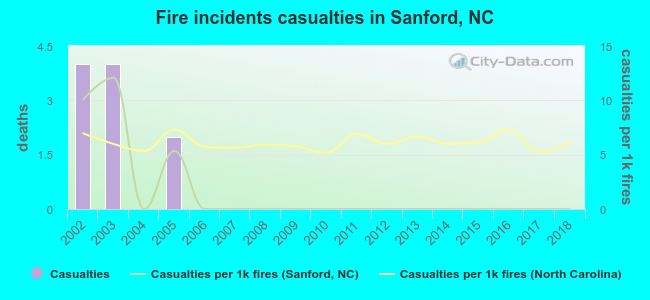 Based on the reports from the years 2002 - 2018 the average number of fire-related casualties per year is 1. The highest number of reported casualties - 4 took place in 2002, and the lowest - 0 in 2004. The data has a dropping trend.
The average number of injuries per 1,000 fire incidents is 2. This indicator was the highest - 12 in 2003, and the lowest 0 in 2004. The trend for casualties per 1,000 fires is declining. Compared to the state value the number of injuries per 1,000 incidents is much lower.
Based on the reports from the years 2002 - 2018 the average number of fire-related casualties per year is 1. The highest number of reported casualties - 4 took place in 2002, and the lowest - 0 in 2004. The data has a dropping trend.
The average number of injuries per 1,000 fire incidents is 2. This indicator was the highest - 12 in 2003, and the lowest 0 in 2004. The trend for casualties per 1,000 fires is declining. Compared to the state value the number of injuries per 1,000 incidents is much lower.Casualties per 1,000 incidents in Sanford, NC compared to nearest cities:
(Note: Based on data for all years, including only cities with at least 500 fire incidents)
| Sanford: | 1.3 |
| Broadway: | 0.0 |
| Cameron: | 1.4 |
| Vass: | 6.0 |
| Carthage: | 2.0 |
| Pittsboro: | 0.7 |
| Lillington: | 2.7 |
| Robbins: | 0.0 |
| Fuquay-Varina: | 2.7 |
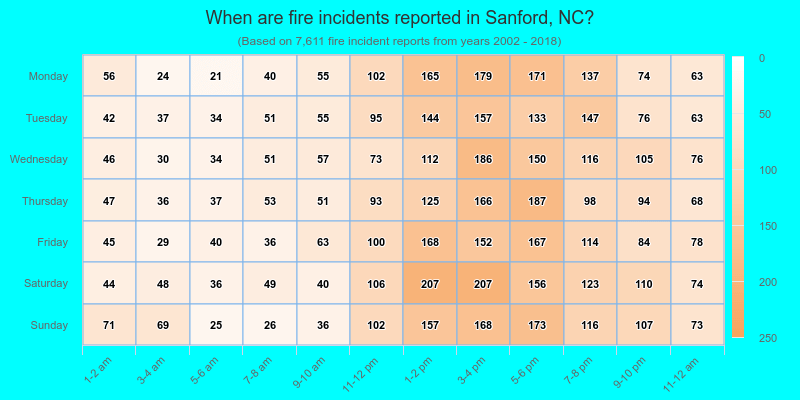
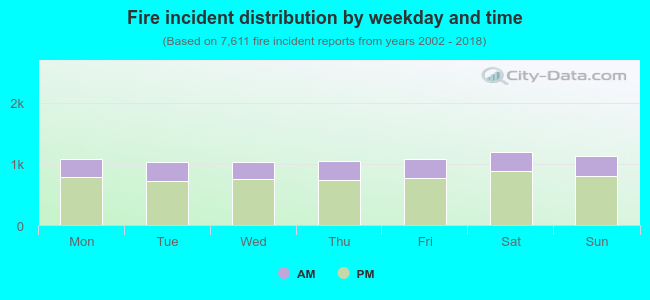 28.7% incidents where reported in the morning and 71.3% in the evening. The most fires (15.8%) took place on Saturday, and the least (13.6%) on Tuesday.
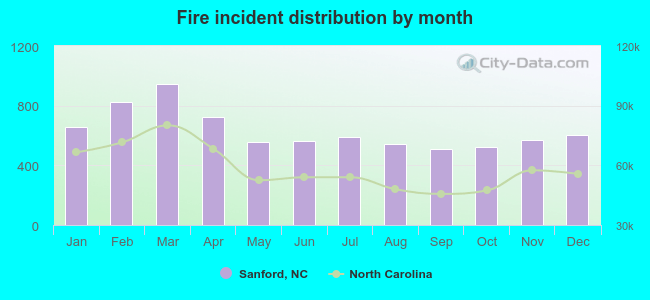 According to the 7,611 fire incident reports from years 2002 - 2018 most fires (12.4%) took place during March, and the least (6.7%) in September.
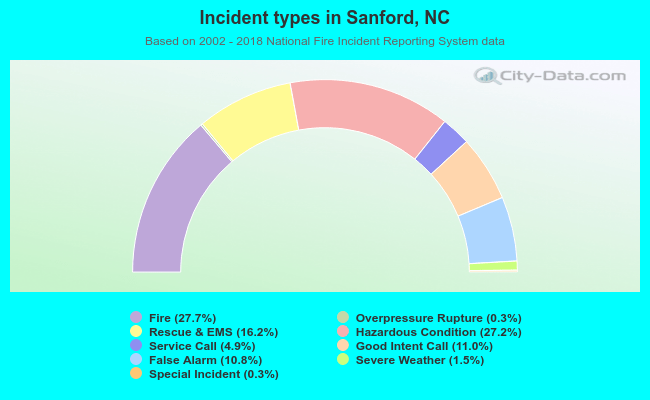 Out of all 27,498 cases reported during the years 2002 - 2018, the most belonged to the categories: Fire (27.7%), Hazardous Condition (27.2%), and Rescue & EMS (16.2%).
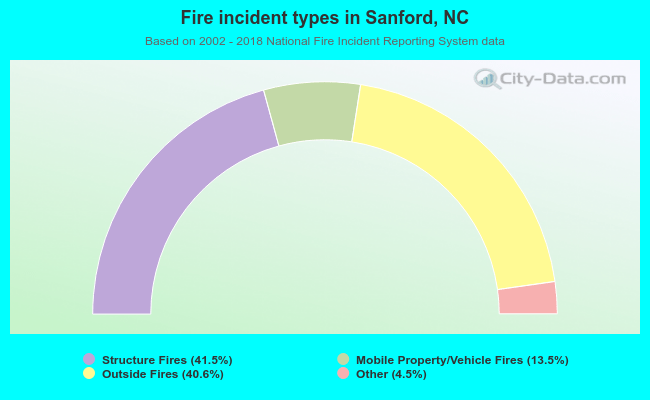 When looking into fire subcategories, the most incidents belonged to: Structure Fires (41.5%), and Outside Fires (40.6%).