Pittsboro: Fire Incidents, North Carolina (NC)
Where are fire incidents reported in Pittsboro, NC
Something went wrong! Please refresh the page.
|
| |||||||||||||||||||||||||||||||||||||||||||||||||||||||||||||||||||||||||||||||||||||||||||||||||||||||||||||
| Other | 479 | |||||||||||||||||||||||||||||||||||||||||||||||||||||||||||||||||||||||||||||||||||||||||||||||||||||||||||||
2002 - 2018 National Fire Incident Reporting System (NFIRS) incidents
- Incident types reported to NFIRS in Pittsboro, NC
- 4,94450.6%Rescue & EMS
- 1,44914.8%Fire
- 1,42314.6%Hazardous Condition
- 8238.4%False Alarm
- 6316.5%Good Intent Call
- 4935.0%Service Call
- 110.1%Severe Weather
- Fire incident types reported to NFIRS in Pittsboro, NC
- 67646.7%Structure Fires
- 43329.9%Outside Fires
- 19913.7%Mobile Property/Vehicle Fires
- 1419.7%Other
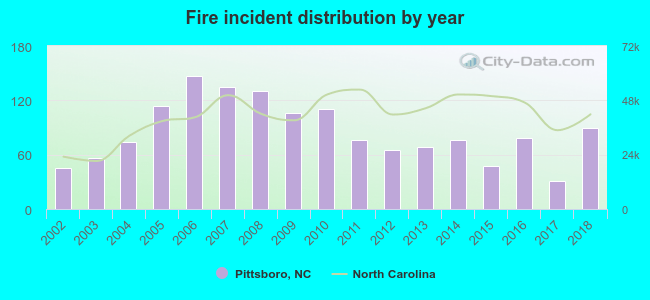 Based on the data from the years 2002 - 2018 the average number of fires per year is 85. The highest number of fires - 147 took place in 2006, and the least - 31 in 2017. The data has an increasing trend.
 The median response time based on all reported fire incidents is 8 minutes. This is higher compared to the North Carolina median value.
The median response time in Pittsboro, NC compared to nearest cities:
(Note: Based on data for all years, including only cities with at least 500 fire incidents)
| Pittsboro: | 8 minutes |
| Carrboro: | 4 minutes |
| Siler City: | 7 minutes |
| Chapel Hill: | 5 minutes |
| Sanford: | 6 minutes |
| Apex: | 6 minutes |
| Broadway: | 10 minutes |
| Holly Springs: | 6 minutes |
| Morrisville: | 6 minutes |
 29.8% incidents where reported in the morning and 70.2% in the evening. The most fires (16.9%) took place on Saturday, and the least (13.4%) on Tuesday.
 Based on the 1,449 reports from years 2002 - 2018 most fires (12.1%) took place during March, and the least (6.4%) in May.
 Out of all 9,780 cases reported during the years 2002 - 2018, the most belonged to the categories: Overpressure Rupture (50.6%), Fire (14.8%), and Rescue & EMS (14.6%).
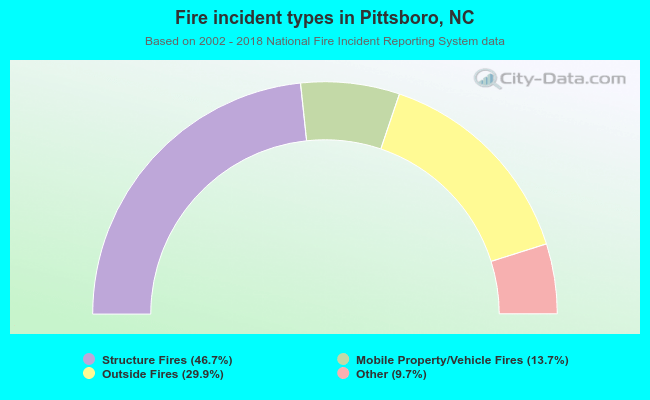 When looking into fire subcategories, the most incidents belonged to: Structure Fires (46.7%), and Outside Fires (29.9%).