Shiloh: Fire Incidents, Ohio (OH)
Where are fire incidents reported in Shiloh, OH
Something went wrong! Please refresh the page.
|
| |||||||||||||||||||||||||||||||||||||||||||||||||||||||||||||||||||||||||||||||||||||||||||||||||||||||||||||
2002 - 2018 National Fire Incident Reporting System (NFIRS) incidents
- Incident types reported to NFIRS in Shiloh, OH
- 37534.1%Rescue & EMS
- 36433.1%Fire
- 16414.9%Hazardous Condition
- 958.6%Good Intent Call
- 736.6%Service Call
- 262.4%False Alarm
- 20.2%Severe Weather
- Fire incident types reported to NFIRS in Shiloh, OH
- 19854.4%Structure Fires
- 12534.3%Outside Fires
- 3910.7%Mobile Property/Vehicle Fires
- 20.5%Other
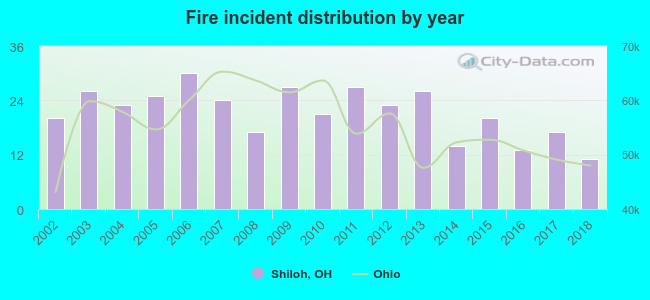 Based on the data from the years 2002 - 2018 the average number of fire incidents per year is 21. The highest number of reported fire incidents - 30 took place in 2006, and the least - 11 in 2018. The data has a declining trend.
The average number of yearly fire incidents per 10k residents in Shiloh, OH compared to nearest cities:
(Note: Based on data for the last 3 years, including only cities with population 5,000 and above)
| Shiloh: | 12.6 |
| Dayton: | 44.3 |
| Trotwood: | 55.3 |
| Vandalia: | 55.9 |
| Clayton: | 22.0 |
| Englewood: | 42.9 |
| Riverside: | 20.2 |
| Huber Heights: | 30.3 |
| Oakwood: | 46.2 |

 29.9% incidents where reported in the morning and 70.1% in the evening. The most fires (15.9%) took place on Wednesday, and the least (12.1%) on Thursday.
 Based on the 364 incident reports from years 2002 - 2018 most fires (12.9%) took place during November, and the least (2.7%) in September.
 Out of all 1,101 cases reported during the years 2002 - 2018, the most belonged to the categories: Rescue & EMS (34.1%), Fire (33.1%), and Hazardous Condition (14.9%).
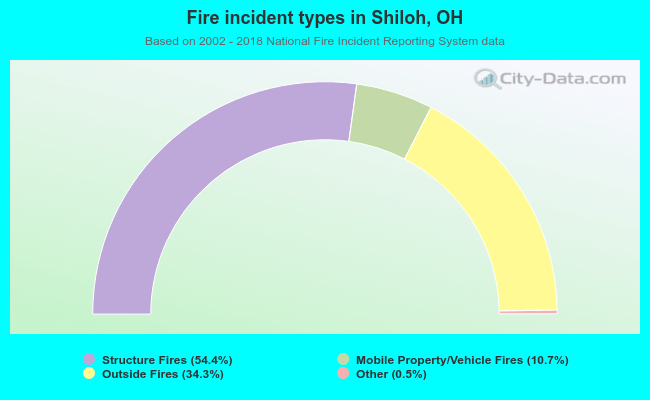 When looking into fire subcategories, the most reports belonged to: Structure Fires (54.4%), and Outside Fires (34.3%).