Trotwood: Fire Incidents, Ohio (OH)
Where are fire incidents reported in Trotwood, OH
Something went wrong! Please refresh the page.
| Fire incidents reported | |
|---|---|
| Sreet name | Count |
| SHILOH SPRINGS RD | 208 |
| SALEM AVE | 166 |
| CULZEAN DR | 136 |
| LITTLE RICHMOND RD | 120 |
| THIRD ST | 120 |
| GARDENDALE AVE | 110 |
| WOLF CREEK PIKE | 106 |
| MAIN ST | 94 |
| OLIVE RD | 88 |
| FREUDENBERGER AVE | 80 |
| UNION RD | 80 |
| DENLINGER RD | 72 |
| OUTER BELLE RD | 62 |
| MILLER AVE | 54 |
| MORGAN AVE | 48 |
| FIELDSTONE DR | 46 |
| ANNAPOLIS AVE | 44 |
| BROADWAY ST | 44 |
| MILLARD RD | 42 |
| NEVADA AVE | 38 |
| AUTUMN WOODS DR | 36 |
| BURMAN AVE | 36 |
| SALEM BEND DR | 36 |
| AUTUMN LEAF DR | 34 |
| HOOVER AVE | 34 |
| 49 & TURNER ROAD RT | 32 |
| AZALEA DR | 32 |
| MACDUFF DR | 32 |
| PINEWOOD CIR | 32 |
| WOLF RD | 32 |
| Other | 452 |
2002 - 2018 National Fire Incident Reporting System (NFIRS) incidents
- Incident types reported to NFIRS in Trotwood, OH
- 22,10669.2%Rescue & EMS
- 2,5468.0%Fire
- 2,4887.8%Hazardous Condition
- 2,0846.5%Good Intent Call
- 1,4744.6%Service Call
- 1,2343.9%False Alarm
- Fire incident types reported to NFIRS in Trotwood, OH
- 1,68166.0%Structure Fires
- 50219.7%Outside Fires
- 35714.0%Mobile Property/Vehicle Fires
- 60.2%Other
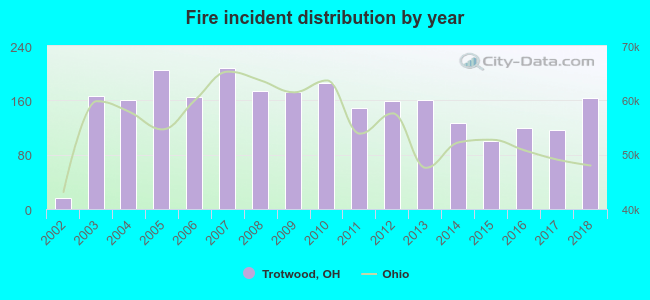 Based on the data from the years 2002 - 2018 the average number of fires per year is 150. The highest number of reported fire incidents - 207 took place in 2007, and the least - 16 in 2002. The data has a growing trend.
The average number of yearly fire incidents per 10k residents in Trotwood, OH compared to nearest cities:
(Note: Based on data for the last 3 years, including only cities with population 5,000 and above)
| Trotwood: | 55.3 |
| Shiloh: | 12.6 |
| Clayton: | 22.0 |
| Englewood: | 42.9 |
| Dayton: | 44.3 |
| Brookville: | 101.8 |
| Union: | 18.8 |
| Moraine: | 108.9 |
| Vandalia: | 55.9 |
 The median response time based on all reported fire incidents is 7 minutes. This is comparable to the state median value.
The median response time in Trotwood, OH compared to nearest cities:
(Note: Based on data for all years, including only cities with at least 500 fire incidents)
| Trotwood: | 7 minutes |
| Englewood: | 5 minutes |
| Dayton: | 5 minutes |
| New Lebanon: | 7 minutes |
| Brookville: | 7 minutes |
| Moraine: | 5 minutes |
| Vandalia: | 6 minutes |
| Oakwood: | 5 minutes |
| West Carrollton: | 5 minutes |
 Based on the reports from the years 2002 - 2018 the average number of fire-related fatalities per year is 1. The highest number of reported deaths - 2 took place in 2004, and the lowest - 0 in 2002. The data has an increasing trend.
The average number of fatalities per 1,000 fires is 3. This indicator was the highest - 13 in 2004, and the lowest 0 in 2002. The trend for deaths per 1,000 fires is increasing. Compared to the state value the number of deaths per 1,000 incidents is higher.
Based on the reports from the years 2002 - 2018 the average number of fire-related fatalities per year is 1. The highest number of reported deaths - 2 took place in 2004, and the lowest - 0 in 2002. The data has an increasing trend.
The average number of fatalities per 1,000 fires is 3. This indicator was the highest - 13 in 2004, and the lowest 0 in 2002. The trend for deaths per 1,000 fires is increasing. Compared to the state value the number of deaths per 1,000 incidents is higher.Deaths per 1,000 incidents in Trotwood, OH compared to nearest cities:
(Note: Based on data for all years, including only cities with at least 2,500 fire incidents)
| Trotwood: | 3.5 |
| Dayton: | 3.4 |
| Middletown: | 2.1 |
 According to the reports from the years 2002 - 2018 the average number of fire-related yearly casualties is 5. The highest number of injuries - 12 took place in 2006, and the lowest - 0 in 2002. The data has a growing trend.
The average number of casualties per 1,000 fires is 32. This indicator was the highest - 73 in 2006, and the lowest 0 in 2002. The trend for casualties per 1,000 fire incidents is increasing. Compared to the Ohio value the number of injuries per 1,000 fires is much higher.
According to the reports from the years 2002 - 2018 the average number of fire-related yearly casualties is 5. The highest number of injuries - 12 took place in 2006, and the lowest - 0 in 2002. The data has a growing trend.
The average number of casualties per 1,000 fires is 32. This indicator was the highest - 73 in 2006, and the lowest 0 in 2002. The trend for casualties per 1,000 fire incidents is increasing. Compared to the Ohio value the number of injuries per 1,000 fires is much higher.Casualties per 1,000 incidents in Trotwood, OH compared to nearest cities:
(Note: Based on data for all years, including only cities with at least 500 fire incidents)
| Trotwood: | 34.2 |
| Englewood: | 27.4 |
| Dayton: | 20.5 |
| New Lebanon: | 12.0 |
| Brookville: | 5.1 |
| Moraine: | 20.1 |
| Vandalia: | 34.9 |
| Oakwood: | 2.1 |
| West Carrollton: | 23.9 |
 31.5% incidents where reported in the morning and 68.5% in the evening. The most fires (16.2%) took place on Sunday, and the least (12.9%) on Tuesday.
 According to the 2,546 reports from years 2002 - 2018 most fires (10.4%) took place during July, and the least (6.4%) in February.
 Out of all 31,958 cases reported during the years 2002 - 2018, the most belonged to the categories: Rescue & EMS (69.2%), Fire (8.0%), and Hazardous Condition (7.8%).
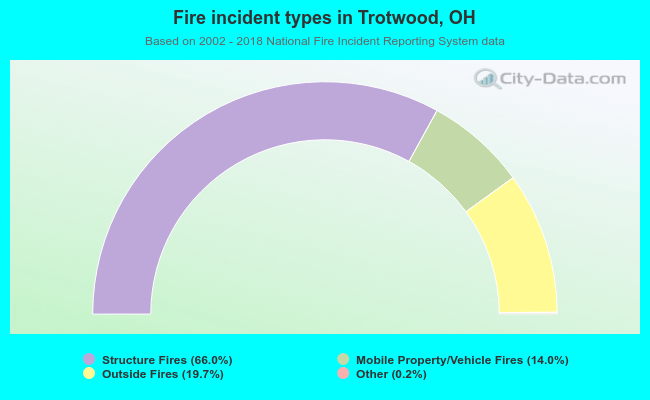 When looking into fire subcategories, the most incidents belonged to: Structure Fires (66.0%), and Outside Fires (19.7%).