Solon: Fire Incidents, Ohio (OH)
Where are fire incidents reported in Solon, OH
Something went wrong! Please refresh the page.
| Fire incidents reported | |
|---|---|
| Sreet name | Count |
| SOLON RD | 312 |
| COCHRAN RD | 192 |
| AURORA RD | 108 |
| BAINBRIDGE RD | 86 |
| S O M CENTER RD | 60 |
| ENTERPRISE PKWY | 44 |
| AURORA | 42 |
| KRUSE DR | 42 |
| HARPER RD | 32 |
| SOLON | 30 |
| CANNON RD | 22 |
| COCHRAN | 22 |
| MILES RD | 22 |
| PARK | 22 |
| HAMILTON CT | 20 |
| PETTIBONE RD | 16 |
| SOLON INDUSTRIAL PKWY | 16 |
| ENTERPRISE | 12 |
| FREEWAY | 12 |
| LEDGEBROOK | 12 |
| LIBERTY RD | 12 |
| SOLON RD | 12 |
| SOM CENTER RD | 12 |
| AURORA RD | 10 |
| BRIARHILL DR | 10 |
| COCHRAN RD | 10 |
| FRANKLIN DR | 10 |
| GLENALLEN | 10 |
| KRUSE | 10 |
| RICHMOND RD | 10 |
2003 - 2018 National Fire Incident Reporting System (NFIRS) incidents
- Incident types reported to NFIRS in Solon, OH
- 8,31461.3%Rescue & EMS
- 1,54911.4%Hazardous Condition
- 1,2479.2%False Alarm
- 1,0107.4%Fire
- 9857.3%Service Call
- 4493.3%Good Intent Call
- Fire incident types reported to NFIRS in Solon, OH
- 56956.3%Structure Fires
- 33433.1%Outside Fires
- 10610.5%Mobile Property/Vehicle Fires
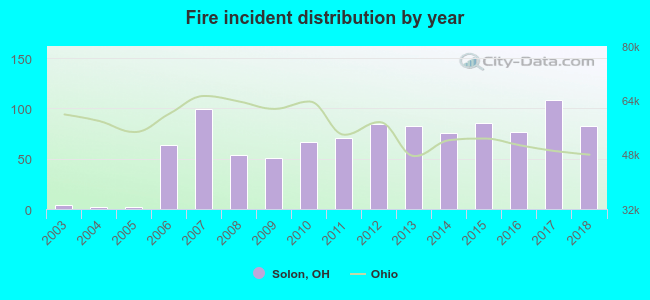 According to the data from the years 2003 - 2018 the average number of fire incidents per year is 63. The highest number of fires - 108 took place in 2017, and the least - 2 in 2004. The data has a rising trend.
The average number of yearly fire incidents per 10k residents in Solon, OH compared to nearest cities:
(Note: Based on data for the last 3 years, including only cities with population 5,000 and above)
| Solon: | 38.6 |
| Bedford Heights: | 28.7 |
| Twinsburg: | 40.7 |
| Bedford: | 51.5 |
| Warrensville Heights: | 5.3 |
| Macedonia: | 29.9 |
| Pepper Pike: | 24.7 |
| Maple Heights: | 15.1 |
| Aurora: | 19.9 |
 The median response time based on all reported fire incidents is 6 minutes. This is comparable to the state median value.
The median response time in Solon, OH compared to nearest cities:
(Note: Based on data for all years, including only cities with at least 500 fire incidents)
| Solon: | 6 minutes |
| Twinsburg: | 5 minutes |
| Bedford: | 4 minutes |
| Bainbridge: | 15 minutes |
| Macedonia: | 5 minutes |
| Aurora: | 5 minutes |
| Beachwood: | 4 minutes |
| Shaker Heights: | 4 minutes |
| Garfield Heights: | 4 minutes |
 Based on the reports from the years 2003 - 2018 the average number of fire-related casualties per year is 1. The highest number of casualties - 2 took place in 2007, and the lowest - 0 in 2003. The data has a constant trend.
The average number of casualties per 1,000 fire incidents is 11. This indicator was the highest - 37 in 2008, and the lowest 0 in 2003. The trend for casualties per 1,000 incidents is rising. Compared to the state value the number of casualties per 1,000 fire incidents is about the same.
Based on the reports from the years 2003 - 2018 the average number of fire-related casualties per year is 1. The highest number of casualties - 2 took place in 2007, and the lowest - 0 in 2003. The data has a constant trend.
The average number of casualties per 1,000 fire incidents is 11. This indicator was the highest - 37 in 2008, and the lowest 0 in 2003. The trend for casualties per 1,000 incidents is rising. Compared to the state value the number of casualties per 1,000 fire incidents is about the same.Casualties per 1,000 incidents in Solon, OH compared to nearest cities:
(Note: Based on data for all years, including only cities with at least 500 fire incidents)
| Solon: | 12.9 |
| Twinsburg: | 17.0 |
| Bedford: | 17.1 |
| Bainbridge: | 2.3 |
| Macedonia: | 2.9 |
| Aurora: | 37.6 |
| Beachwood: | 2.9 |
| Shaker Heights: | 49.0 |
| Garfield Heights: | 16.2 |
 33.3% incidents where reported in the morning and 66.7% in the evening. The most fires (16.7%) took place on Monday, and the least (9.8%) on Sunday.
 According to the 1,010 fires from years 2003 - 2018 most fires (12.5%) took place during May, and the least (4.7%) in January.
 Out of all 13,573 cases reported during the years 2003 - 2018, the most belonged to the categories: Rescue & EMS (61.3%), Hazardous Condition (11.4%), and False Alarm (9.2%).
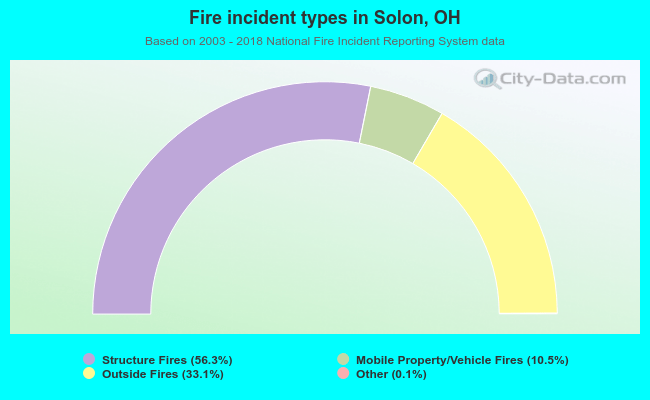 When looking into fire subcategories, the most incidents belonged to: Structure Fires (56.3%), and Outside Fires (33.1%).