South Elgin: Fire Incidents, Illinois (IL)
Where are fire incidents reported in South Elgin, IL
Something went wrong! Please refresh the page.
| Fire incidents reported | |
|---|---|
| Sreet name | Count |
| RANDALL RD | 162 |
| SPRING ST | 54 |
| MCLEAN BLVD | 52 |
| LAFOX ST | 48 |
| DEAN DR | 44 |
| RAYMOND ST | 36 |
| NICOLE DR | 26 |
| SUNDOWN RD | 26 |
| HOPPS RD | 24 |
| FIELDCREST DR | 22 |
| KANE ST | 22 |
| MANCHESTER CT | 22 |
| BOWES RD | 20 |
| COLE DR | 18 |
| COLLINS ST | 18 |
| MIDDLE ST | 18 |
| SPRING AVE | 18 |
| FAIRVIEW LN | 16 |
| MAIN ST | 16 |
| MARK ST | 16 |
| STATE ST | 16 |
| WATER ST | 16 |
| BECK AVE | 14 |
| BROOKWOOD DR | 14 |
| CORRON RD | 14 |
| DEAN ST | 14 |
| GALE ST | 14 |
| GYORR AVE | 14 |
| ILL ROUTE 25 | 14 |
| ILL ROUTE 31 | 14 |
| Other | 274 |
2002 - 2018 National Fire Incident Reporting System (NFIRS) incidents
- Incident types reported to NFIRS in South Elgin, IL
- 8,17854.7%Rescue & EMS
- 2,08814.0%False Alarm
- 1,69611.3%Hazardous Condition
- 1,0967.3%Fire
- 9916.6%Service Call
- 8695.8%Good Intent Call
- Fire incident types reported to NFIRS in South Elgin, IL
- 50145.7%Structure Fires
- 45241.2%Outside Fires
- 1009.1%Mobile Property/Vehicle Fires
- 433.9%Other
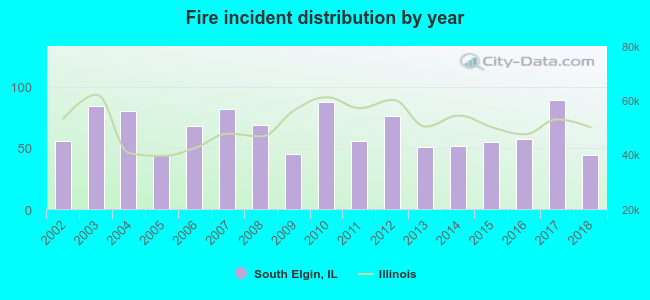 According to the data from the years 2002 - 2018 the average number of fires per year is 64. The highest number of fires - 89 took place in 2017, and the least - 44 in 2005. The data has a declining trend.
The average number of yearly fire incidents per 10k residents in South Elgin, IL compared to nearest cities:
(Note: Based on data for the last 3 years, including only cities with population 5,000 and above)
| South Elgin: | 28.5 |
| Elgin: | 28.3 |
| Bartlett: | 17.8 |
| Campton Hills: | 1.3 |
| Streamwood: | 21.8 |
| West Dundee: | 40.1 |
| Geneva: | 36.2 |
| Pingree Grove: | 36.9 |
| Gilberts: | 22.5 |
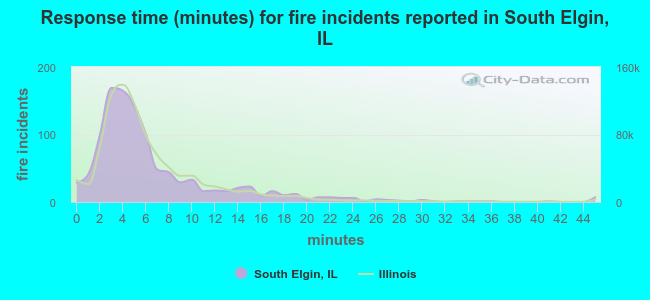 The median response time based on all reported fire incidents is 5 minutes. This is about the same as the Illinois median value.
The median response time in South Elgin, IL compared to nearest cities:
(Note: Based on data for all years, including only cities with at least 500 fire incidents)
| South Elgin: | 5 minutes |
| Elgin: | 4 minutes |
| St. Charles: | 5 minutes |
| Bartlett: | 5 minutes |
| Streamwood: | 5 minutes |
| Geneva: | 5 minutes |
| Hanover Park: | 4 minutes |
| West Chicago: | 6 minutes |
| Carpentersville: | 5 minutes |
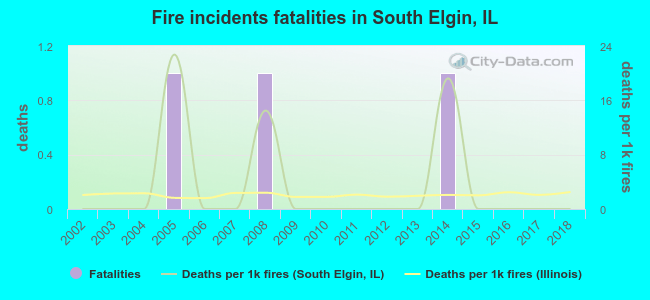 Based on the reports from the years 2002 - 2018 the average number of fire-related yearly deaths is 0. The highest number of deaths - 1 took place in 2005, and the lowest - 0 in 2002. The data has a constant trend.
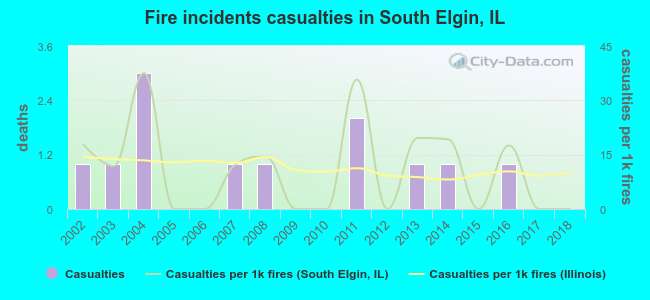 According to the data from the years 2002 - 2018 the average number of fire-related casualties per year is 1. The highest number of casualties - 3 took place in 2004, and the lowest - 0 in 2005. The data has a decreasing trend.
The average number of casualties per 1,000 fire incidents is 11. This indicator was the highest - 38 in 2004, and the lowest 0 in 2005. The trend for casualties per 1,000 fire incidents is dropping. Compared to the Illinois value the number of casualties per 1,000 incidents is similar.
According to the data from the years 2002 - 2018 the average number of fire-related casualties per year is 1. The highest number of casualties - 3 took place in 2004, and the lowest - 0 in 2005. The data has a decreasing trend.
The average number of casualties per 1,000 fire incidents is 11. This indicator was the highest - 38 in 2004, and the lowest 0 in 2005. The trend for casualties per 1,000 fire incidents is dropping. Compared to the Illinois value the number of casualties per 1,000 incidents is similar.Casualties per 1,000 incidents in South Elgin, IL compared to nearest cities:
(Note: Based on data for all years, including only cities with at least 500 fire incidents)
| South Elgin: | 10.9 |
| Elgin: | 25.6 |
| St. Charles: | 7.9 |
| Bartlett: | 11.6 |
| Streamwood: | 15.0 |
| Geneva: | 4.5 |
| Hanover Park: | 36.5 |
| West Chicago: | 20.6 |
| Carpentersville: | 13.6 |
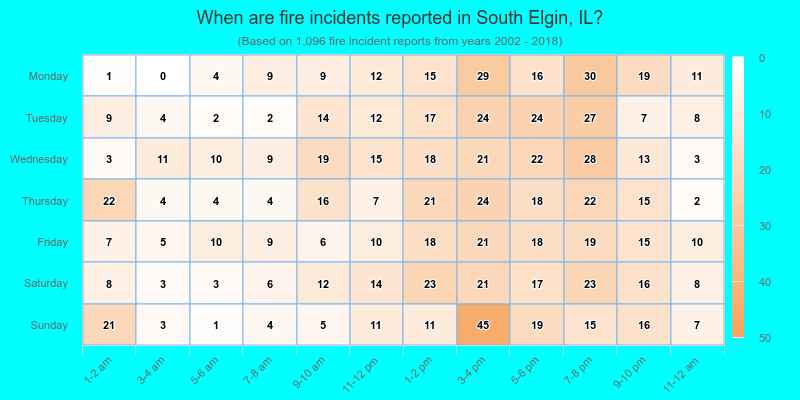
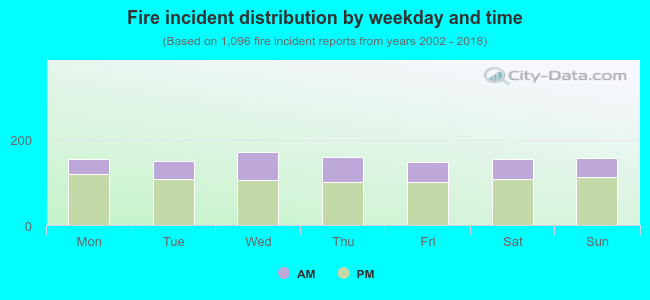 31.0% incidents where reported in the morning and 69.0% in the evening. The most fires (15.7%) took place on Wednesday, and the least (13.5%) on Friday.
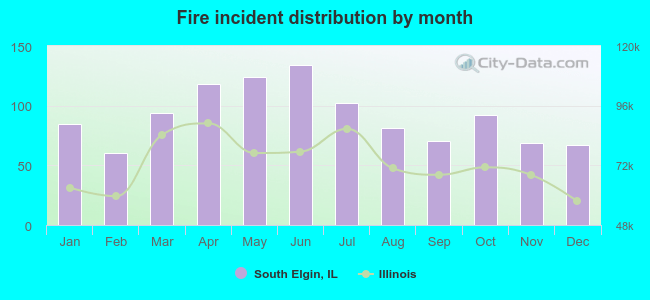 According to the 1,096 fires from years 2002 - 2018 most fires (12.2%) took place during June, and the least (5.5%) in February.
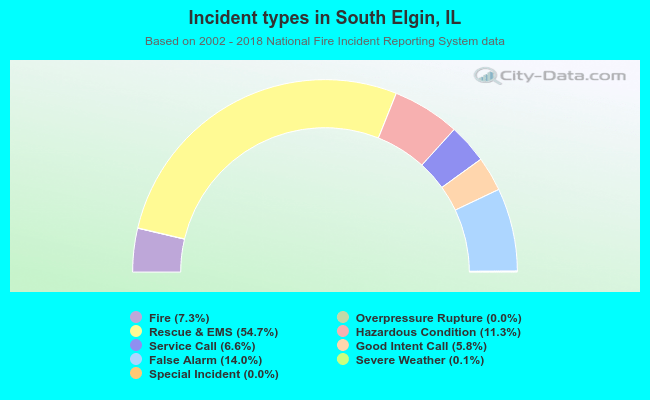 Out of all 14,945 cases reported during the years 2002 - 2018, the most belonged to the categories: Rescue & EMS (54.7%), False Alarm (14.0%), and Hazardous Condition (11.3%).
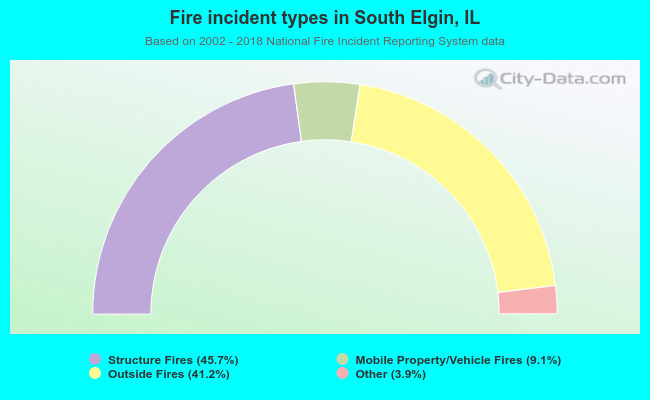 When looking into fire subcategories, the most reports belonged to: Structure Fires (45.7%), and Outside Fires (41.2%).