Carpentersville: Fire Incidents, Illinois (IL)
Where are fire incidents reported in Carpentersville, IL
Something went wrong! Please refresh the page.
| Fire incidents reported | |
|---|---|
| Sreet name | Count |
| OXFORD RD | 160 |
| KENNEDY DR | 90 |
| KINGS RD | 72 |
| MAPLE AVE | 72 |
| WESTERN AVE | 68 |
| MEADOWDALE CT | 54 |
| NAVAJO DR | 54 |
| TULSA AVE | 46 |
| AMARILLO DR | 44 |
| SPARROW RD | 42 |
| OAKCREST DR | 40 |
| RANDALL RD | 38 |
| BIRCH ST | 36 |
| HUNTLEY RD | 34 |
| MAIN ST | 34 |
| LAKE MARIAN RD | 32 |
| BERKSHIRE CIR | 30 |
| GOLFVIEW LN | 30 |
| SILVERSTONE DR | 30 |
| CHIPPEWA CIR | 28 |
| DELAWARE ST | 28 |
| OLLIE CT | 28 |
| HAZARD RD | 26 |
| MILLER RD | 26 |
| MONROE AVE | 26 |
| SACRAMENTO DR | 26 |
| TEE LN | 26 |
| BOLZ RD | 24 |
| HARRISON ST | 24 |
| LINCOLN AVE | 24 |
| Other | 615 |
2002 - 2018 National Fire Incident Reporting System (NFIRS) incidents
- Incident types reported to NFIRS in Carpentersville, IL
- 12,29459.4%Rescue & EMS
- 2,49312.0%Hazardous Condition
- 1,9079.2%Fire
- 1,4807.2%False Alarm
- 1,3316.4%Service Call
- 1,0355.0%Good Intent Call
- 1090.5%Special Incident
- 270.1%Overpressure Rupture
- 220.1%Severe Weather
- Fire incident types reported to NFIRS in Carpentersville, IL
- 1,10557.9%Structure Fires
- 54628.6%Outside Fires
- 1829.5%Mobile Property/Vehicle Fires
- 743.9%Other
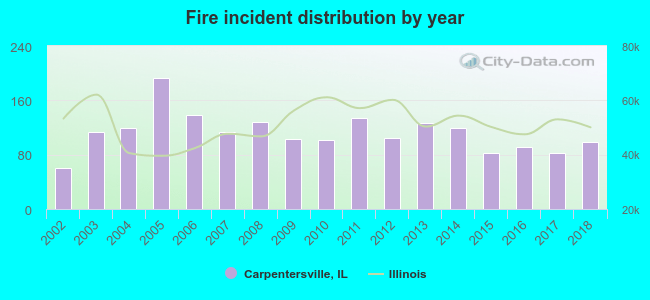 According to the data from the years 2002 - 2018 the average number of fires per year is 112. The highest number of reported fires - 193 took place in 2005, and the least - 60 in 2002. The data has a growing trend.
The average number of yearly fire incidents per 10k residents in Carpentersville, IL compared to nearest cities:
(Note: Based on data for the last 3 years, including only cities with population 5,000 and above)
| Carpentersville: | 23.7 |
| West Dundee: | 40.1 |
| Algonquin: | 14.0 |
| Gilberts: | 22.5 |
| Elgin: | 28.3 |
| Lake in the Hills: | 10.8 |
| Cary: | 25.9 |
| Barrington: | 52.1 |
| Crystal Lake: | 24.9 |
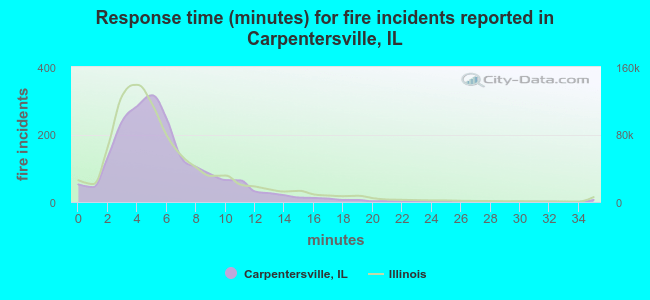 The median response time based on all reported fire incidents is 5 minutes. This is close to the Illinois median value.
The median response time in Carpentersville, IL compared to nearest cities:
(Note: Based on data for all years, including only cities with at least 500 fire incidents)
| Carpentersville: | 5 minutes |
| Algonquin: | 5 minutes |
| Elgin: | 4 minutes |
| Lake in the Hills: | 5 minutes |
| Cary: | 5 minutes |
| Barrington: | 7 minutes |
| Crystal Lake: | 6 minutes |
| Huntley: | 7 minutes |
| Streamwood: | 5 minutes |
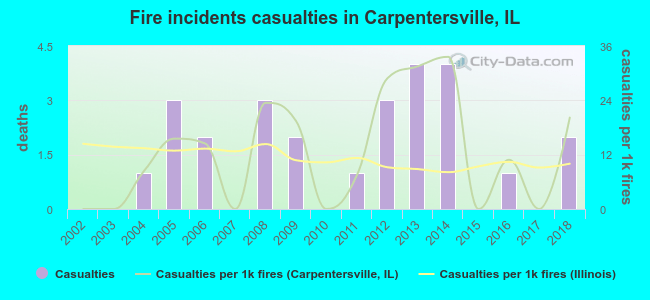 Based on the reports from the years 2002 - 2018 the average number of fire-related casualties per year is 2. The highest number of reported casualties - 4 took place in 2013, and the lowest - 0 in 2002. The data has an increasing trend.
The average number of casualties per 1,000 fire incidents is 13. This indicator was the highest - 34 in 2014, and the lowest 0 in 2002. The trend for casualties per 1,000 fire incidents is rising. Compared to the Illinois value the number of casualties per 1,000 fire incidents is higher.
Based on the reports from the years 2002 - 2018 the average number of fire-related casualties per year is 2. The highest number of reported casualties - 4 took place in 2013, and the lowest - 0 in 2002. The data has an increasing trend.
The average number of casualties per 1,000 fire incidents is 13. This indicator was the highest - 34 in 2014, and the lowest 0 in 2002. The trend for casualties per 1,000 fire incidents is rising. Compared to the Illinois value the number of casualties per 1,000 fire incidents is higher.Casualties per 1,000 incidents in Carpentersville, IL compared to nearest cities:
(Note: Based on data for all years, including only cities with at least 500 fire incidents)
| Carpentersville: | 13.6 |
| Algonquin: | 7.7 |
| Elgin: | 25.6 |
| Lake in the Hills: | 6.1 |
| Cary: | 1.4 |
| Barrington: | 5.8 |
| Crystal Lake: | 9.7 |
| Huntley: | 1.9 |
| Streamwood: | 15.0 |
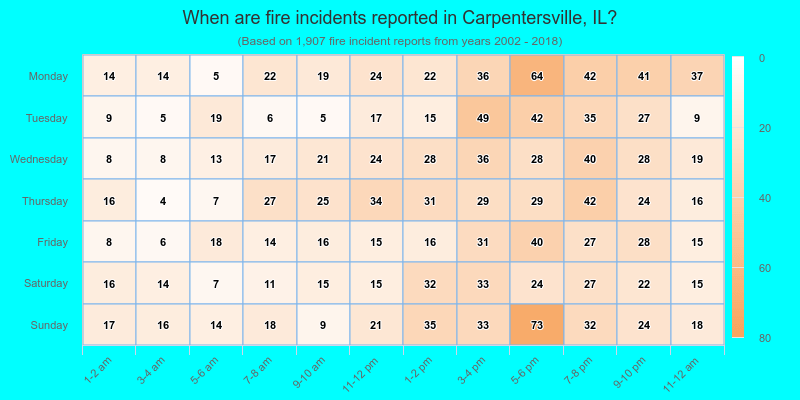
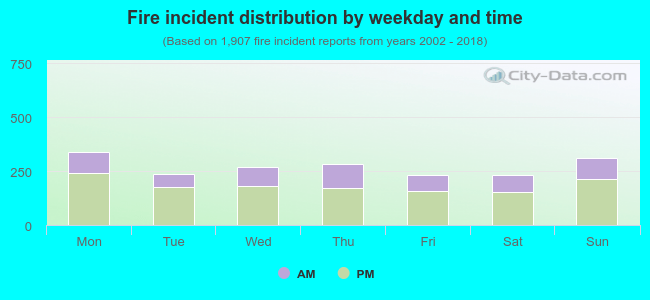 32.1% incidents where reported in the morning and 67.9% in the evening. The most fires (17.8%) took place on Monday, and the least (12.1%) on Saturday.
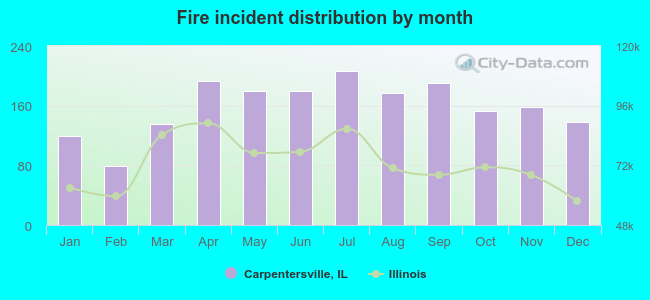 According to the 1,907 fires from years 2002 - 2018 most fires (10.8%) took place during July, and the least (4.1%) in February.
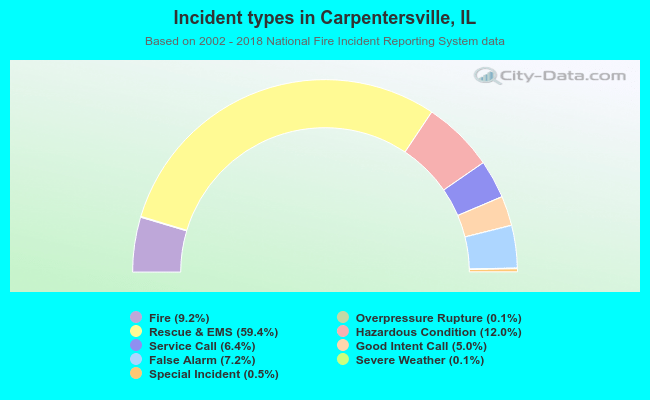 Out of all 20,698 cases reported during the years 2002 - 2018, the most belonged to the categories: Rescue & EMS (59.4%), Hazardous Condition (12.0%), and Fire (9.2%).
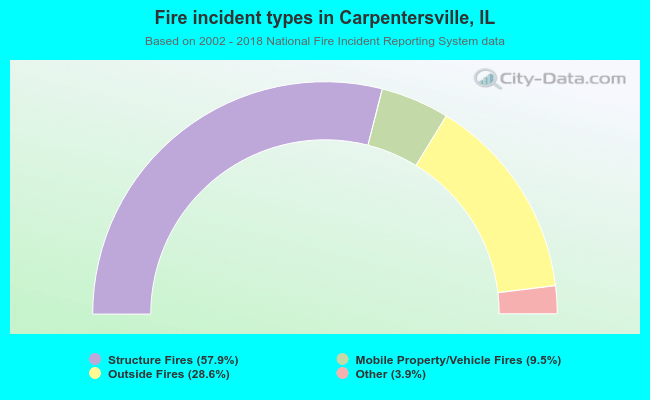 When looking into fire subcategories, the most incidents belonged to: Structure Fires (57.9%), and Outside Fires (28.6%).