South Salt Lake: Fire Incidents, Utah (UT)
Where are fire incidents reported in South Salt Lake, UT
Something went wrong! Please refresh the page.
| Fire incidents reported | |
|---|---|
| Sreet name | Count |
| 300 | 156 |
| STATE ST | 140 |
| 3300 | 126 |
| WEST TEMPLE ST | 92 |
| 500 | 80 |
| 200 | 76 |
| MAIN ST | 68 |
| 900 | 66 |
| 700 | 62 |
| JORDAN RIVER PKWY TRL | 44 |
| 3900 | 34 |
| BLAIR ST | 34 |
| GREGSON AVE | 24 |
| MEADOW BROOK EXPY | 22 |
| 2700 | 20 |
| ADAMS ST | 18 |
| 1000 | 16 |
| 2100 | 16 |
| 400 | 16 |
| CARLISLE PARK PL | 16 |
| 200 E | 14 |
| 300 E | 14 |
| LAMBOURNE AVE | 14 |
| 1030 | 12 |
| 1100 | 12 |
| RIGDON AVE | 12 |
| 3300 S | 10 |
| 3335 | 10 |
| 500 E | 10 |
| 500 WEST | 10 |
2002 - 2018 National Fire Incident Reporting System (NFIRS) incidents
- Incident types reported to NFIRS in South Salt Lake, UT
- 1,23826.0%Good Intent Call
- 1,03621.8%Fire
- 90919.1%False Alarm
- 60412.7%Hazardous Condition
- 47810.0%Service Call
- 4038.5%Rescue & EMS
- 531.1%Special Incident
- 300.6%Severe Weather
- 110.2%Overpressure Rupture
- Fire incident types reported to NFIRS in South Salt Lake, UT
- 45644.0%Structure Fires
- 35634.4%Outside Fires
- 15314.8%Mobile Property/Vehicle Fires
- 716.9%Other
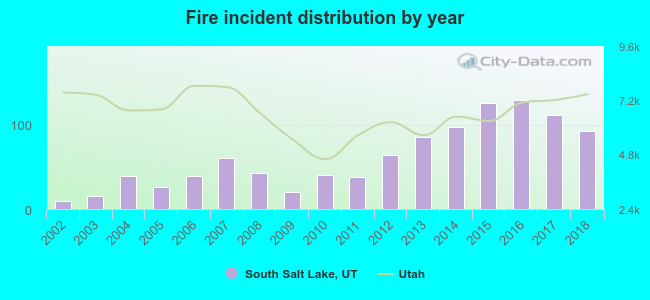 Based on the data from the years 2002 - 2018 the average number of fires per year is 61. The highest number of reported fire incidents - 129 took place in 2016, and the least - 10 in 2002. The data has an increasing trend.
The average number of yearly fire incidents per 10k residents in South Salt Lake, UT compared to nearest cities:
(Note: Based on data for the last 3 years, including only cities with population 5,000 and above)
| South Salt Lake: | 44.9 |
| Millcreek: | 11.9 |
| Salt Lake City: | 27.4 |
| Murray: | 32.0 |
| East Millcreek: | 1.7 |
| Taylorsville: | 20.8 |
| Holladay: | 19.9 |
| West Valley City: | 29.0 |
| Midvale: | 27.1 |
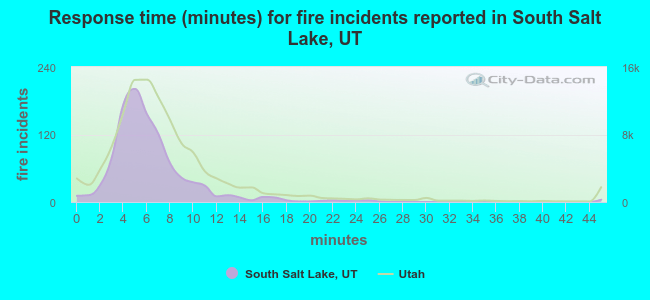 The median response time based on all reported fire incidents is 6 minutes. This is comparable to the Utah median value.
The median response time in South Salt Lake, UT compared to nearest cities:
(Note: Based on data for all years, including only cities with at least 500 fire incidents)
| South Salt Lake: | 6 minutes |
| Salt Lake City: | 7 minutes |
| Murray: | 6 minutes |
| Taylorsville: | 7 minutes |
| Holladay: | 7 minutes |
| West Valley City: | 6 minutes |
| Midvale: | 6 minutes |
| Cottonwood Heights: | 7 minutes |
| Kearns: | 7 minutes |
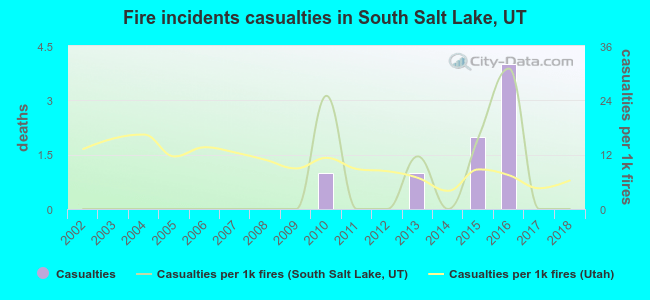 According to the data from the years 2002 - 2018 the average number of fire-related yearly casualties is 0. The highest number of injuries - 4 took place in 2016, and the lowest - 0 in 2002. The data has a constant trend.
The average number of casualties per 1,000 fires is 5. This indicator was the highest - 31 in 2016, and the lowest 0 in 2002. The trend for injuries per 1,000 fire incidents is constant. Compared to the Utah value the number of casualties per 1,000 incidents is lower.
According to the data from the years 2002 - 2018 the average number of fire-related yearly casualties is 0. The highest number of injuries - 4 took place in 2016, and the lowest - 0 in 2002. The data has a constant trend.
The average number of casualties per 1,000 fires is 5. This indicator was the highest - 31 in 2016, and the lowest 0 in 2002. The trend for injuries per 1,000 fire incidents is constant. Compared to the Utah value the number of casualties per 1,000 incidents is lower.Casualties per 1,000 incidents in South Salt Lake, UT compared to nearest cities:
(Note: Based on data for all years, including only cities with at least 500 fire incidents)
| South Salt Lake: | 7.7 |
| Salt Lake City: | 17.1 |
| Murray: | 5.4 |
| Taylorsville: | 8.6 |
| Holladay: | 1.6 |
| West Valley City: | 25.5 |
| Midvale: | 13.4 |
| Cottonwood Heights: | 14.7 |
| Kearns: | 13.4 |
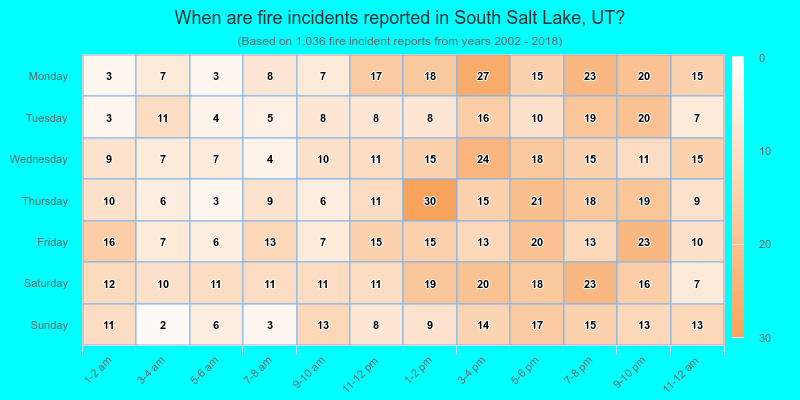
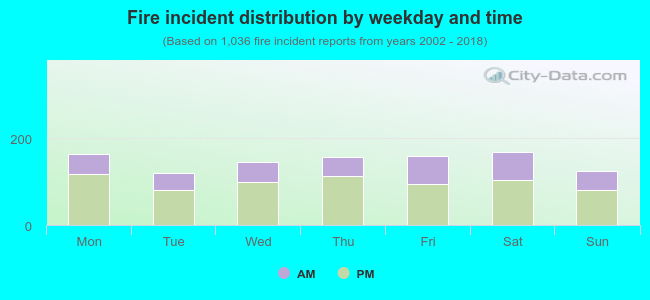 33.8% incidents where reported in the morning and 66.2% in the evening. The most fires (16.3%) took place on Saturday, and the least (11.5%) on Tuesday.
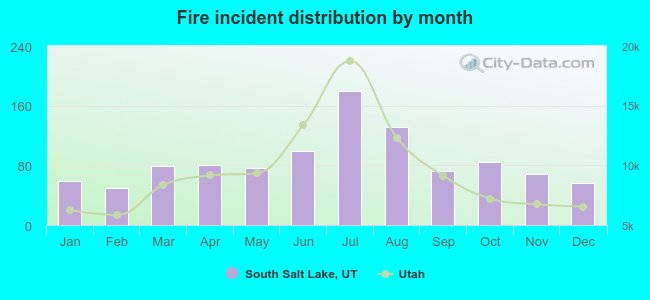 According to the 1,036 fires from years 2002 - 2018 most fires (17.4%) took place during July, and the least (4.7%) in February.
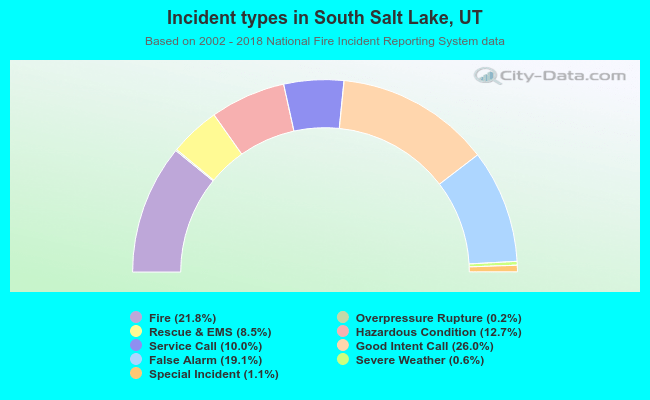 Out of all 4,762 cases reported during the years 2002 - 2018, the most belonged to the categories: Good Intent Call (26.0%), Fire (21.8%), and False Alarm (19.1%).
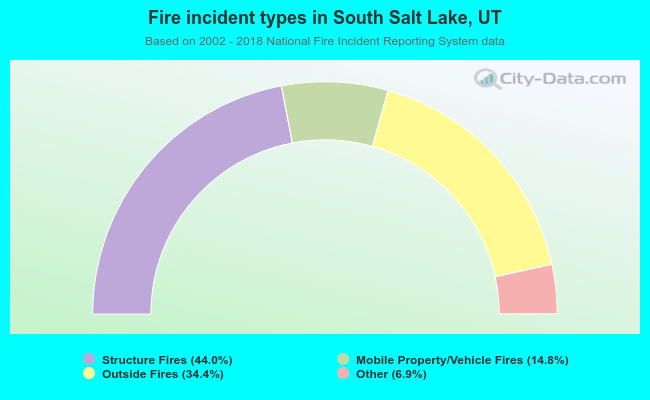 When looking into fire subcategories, the most reports belonged to: Structure Fires (44.0%), and Outside Fires (34.4%).