Taylorsville: Fire Incidents, Utah (UT)
Where are fire incidents reported in Taylorsville, UT
Something went wrong! Please refresh the page.
| Fire incidents reported | |
|---|---|
| Sreet name | Count |
| REDWOOD RD | 364 |
| ATHERTON DR | 90 |
| CLUBHOUSE DR | 82 |
| 5400 | 70 |
| 4700 | 64 |
| 2200 | 62 |
| BANGERTER HWY | 46 |
| 2700 | 40 |
| 5400 S | 38 |
| 3200 | 36 |
| 6200 | 36 |
| SUNSTONE RD | 32 |
| MEADOW BROOK EXPY | 30 |
| 4700 S | 28 |
| GOLD MEDAL DR | 28 |
| 1300 | 26 |
| JORDAN RIVER PKWY TRL | 26 |
| VIXEN WAY | 26 |
| BRIDGESIDE WAY | 24 |
| HUNTINGTON RD | 24 |
| REDWOOD ROAD | 24 |
| BANGERTER SB HWY | 22 |
| RIVERBOAT RD | 22 |
| LEVOY DR | 20 |
| 1175 | 18 |
| 1900 | 18 |
| 1950 | 18 |
| 2200 W | 18 |
| 6235 | 18 |
| CANAL ST | 18 |
| Other | 598 |
2002 - 2018 National Fire Incident Reporting System (NFIRS) incidents
- Incident types reported to NFIRS in Taylorsville, UT
- 17,50573.5%Rescue & EMS
- 1,9668.3%Fire
- 1,6767.0%Good Intent Call
- 1,0344.3%False Alarm
- 8753.7%Hazardous Condition
- 6922.9%Service Call
- 270.1%Special Incident
- Fire incident types reported to NFIRS in Taylorsville, UT
- 94548.1%Structure Fires
- 58829.9%Outside Fires
- 29715.1%Mobile Property/Vehicle Fires
- 1366.9%Other
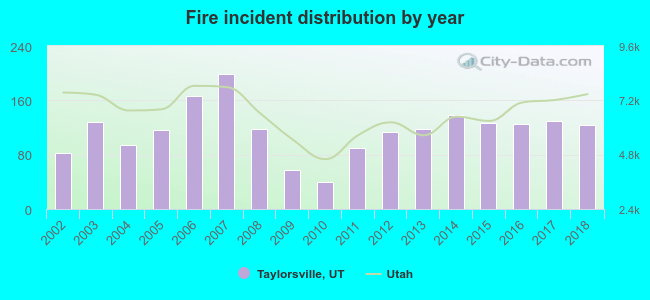 Based on the data from the years 2002 - 2018 the average number of fire incidents per year is 116. The highest number of fire incidents - 199 took place in 2007, and the least - 40 in 2010. The data has an increasing trend.
The average number of yearly fire incidents per 10k residents in Taylorsville, UT compared to nearest cities:
(Note: Based on data for the last 3 years, including only cities with population 5,000 and above)
| Taylorsville: | 20.8 |
| Murray: | 32.0 |
| Kearns: | 20.0 |
| West Valley City: | 29.0 |
| West Jordan: | 11.0 |
| Midvale: | 27.1 |
| South Salt Lake: | 44.9 |
| Millcreek: | 11.9 |
| South Jordan: | 9.0 |
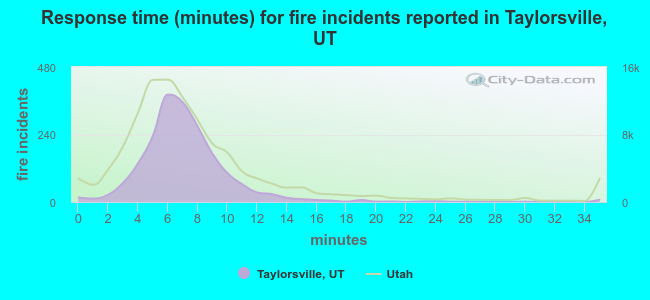 The median response time based on all reported fire incidents is 7 minutes. This is about the same as the Utah median value.
The median response time in Taylorsville, UT compared to nearest cities:
(Note: Based on data for all years, including only cities with at least 500 fire incidents)
| Taylorsville: | 7 minutes |
| Murray: | 6 minutes |
| Kearns: | 7 minutes |
| West Valley City: | 6 minutes |
| West Jordan: | 6 minutes |
| Midvale: | 6 minutes |
| South Salt Lake: | 6 minutes |
| South Jordan: | 7 minutes |
| Holladay: | 7 minutes |
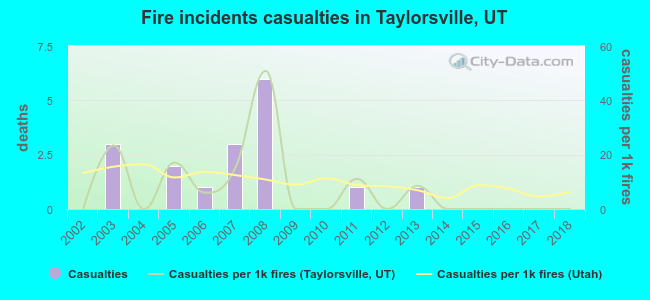 According to the reports from the years 2002 - 2018 the average number of fire-related yearly casualties is 1. The highest number of reported casualties - 6 took place in 2008, and the lowest - 0 in 2002. The data has a constant trend.
The average number of injuries per 1,000 fire incidents is 8. This indicator was the highest - 51 in 2008, and the lowest 0 in 2002. The trend for injuries per 1,000 fire incidents is dropping. Compared to the Utah value the number of injuries per 1,000 fire incidents is similar.
According to the reports from the years 2002 - 2018 the average number of fire-related yearly casualties is 1. The highest number of reported casualties - 6 took place in 2008, and the lowest - 0 in 2002. The data has a constant trend.
The average number of injuries per 1,000 fire incidents is 8. This indicator was the highest - 51 in 2008, and the lowest 0 in 2002. The trend for injuries per 1,000 fire incidents is dropping. Compared to the Utah value the number of injuries per 1,000 fire incidents is similar.Casualties per 1,000 incidents in Taylorsville, UT compared to nearest cities:
(Note: Based on data for all years, including only cities with at least 500 fire incidents)
| Taylorsville: | 8.6 |
| Murray: | 5.4 |
| Kearns: | 13.4 |
| West Valley City: | 25.5 |
| West Jordan: | 14.4 |
| Midvale: | 13.4 |
| South Salt Lake: | 7.7 |
| South Jordan: | 10.1 |
| Holladay: | 1.6 |
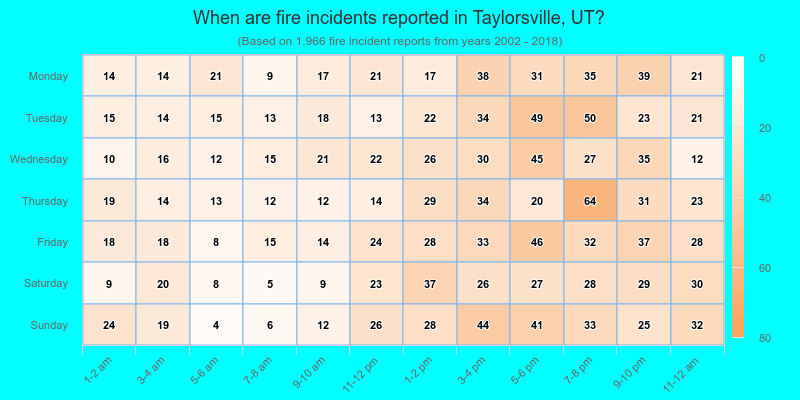
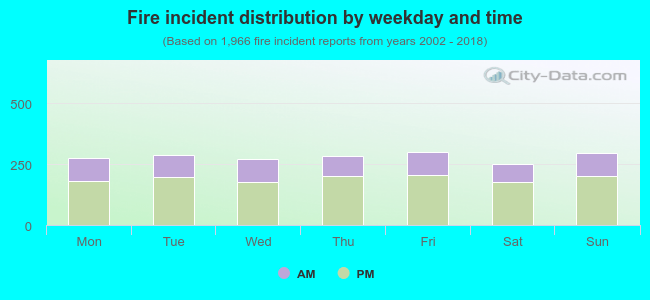 31.8% incidents where reported in the morning and 68.2% in the evening. The most fires (15.3%) took place on Friday, and the least (12.8%) on Saturday.
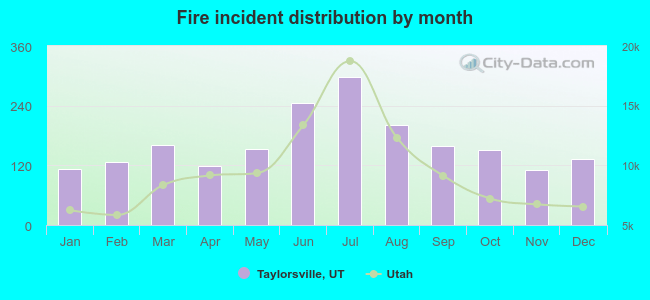 According to the 1,966 reports from years 2002 - 2018 most fires (15.1%) took place during July, and the least (5.6%) in November.
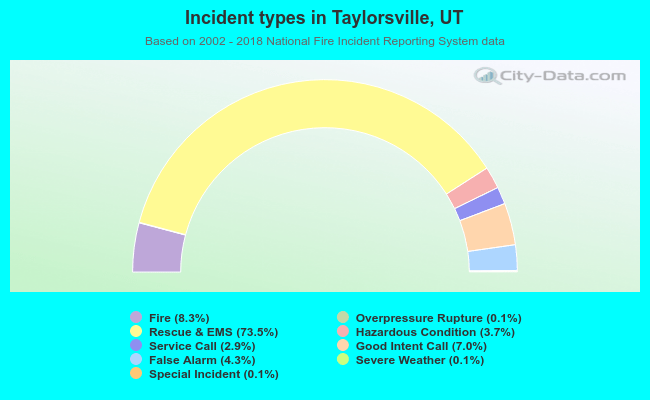 Out of all 23,807 cases reported during the years 2002 - 2018, the most belonged to the categories: Rescue & EMS (73.5%), Fire (8.3%), and Good Intent Call (7.0%).
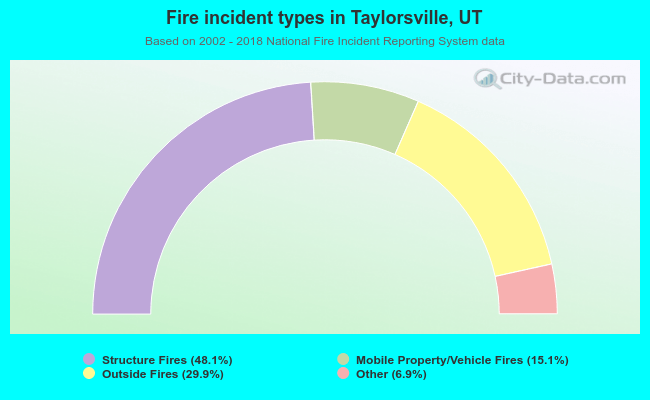 When looking into fire subcategories, the most reports belonged to: Structure Fires (48.1%), and Outside Fires (29.9%).