West Valley City: Fire Incidents, Utah (UT)
Where are fire incidents reported in West Valley City, UT
Something went wrong! Please refresh the page.
| Fire incidents reported | |
|---|---|
| Sreet name | Count |
| REDWOOD RD | 500 |
| 3500 | 466 |
| 5600 | 218 |
| 4100 | 212 |
| CONSTITUTION BLVD | 174 |
| 4000 | 152 |
| 3100 | 146 |
| PARKWAY BLVD | 140 |
| 5400 | 132 |
| 4800 | 96 |
| ROCKWOOD WAY | 94 |
| DEAN DR | 90 |
| 3200 | 88 |
| 3600 | 88 |
| 4700 | 84 |
| U111 HWY | 76 |
| 3800 | 70 |
| 2100 | 66 |
| 6000 | 64 |
| 2200 | 62 |
| CRYSTAL AVE | 60 |
| 6400 | 54 |
| I-215 FWY | 52 |
| LANCER WAY | 52 |
| 3650 | 50 |
| DECKER LAKE DR | 50 |
| 3300 | 46 |
| U-201 HWY | 44 |
| SOUTH FRONTAGE RD | 42 |
| DERBY ST | 40 |
| Other | 1,204 |
2002 - 2018 National Fire Incident Reporting System (NFIRS) incidents
- Incident types reported to NFIRS in West Valley City, UT
- 4,71230.6%Fire
- 2,89818.8%Good Intent Call
- 2,40415.6%Hazardous Condition
- 2,23614.5%False Alarm
- 2,15314.0%Service Call
- 9055.9%Rescue & EMS
- 720.5%Severe Weather
- 300.2%Overpressure Rupture
- Fire incident types reported to NFIRS in West Valley City, UT
- 2,07844.1%Outside Fires
- 1,77437.6%Structure Fires
- 76216.2%Mobile Property/Vehicle Fires
- 982.1%Other
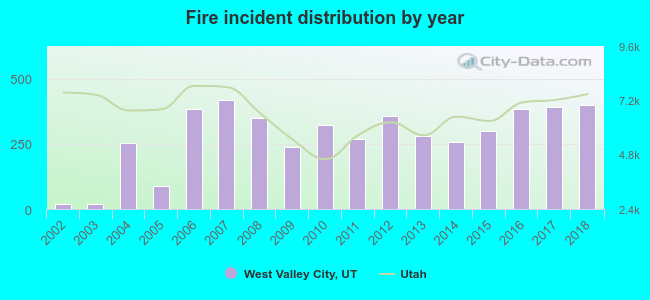 Based on the data from the years 2002 - 2018 the average number of fires per year is 277. The highest number of fires - 417 took place in 2007, and the least - 18 in 2002. The data has a rising trend.
The average number of yearly fire incidents per 10k residents in West Valley City, UT compared to nearest cities:
(Note: Based on data for the last 3 years, including only cities with population 5,000 and above)
| West Valley City: | 29.0 |
| Kearns: | 20.0 |
| Taylorsville: | 20.8 |
| Magna: | 32.1 |
| South Salt Lake: | 44.9 |
| West Jordan: | 11.0 |
| Murray: | 32.0 |
| Millcreek: | 11.9 |
| Salt Lake City: | 27.4 |
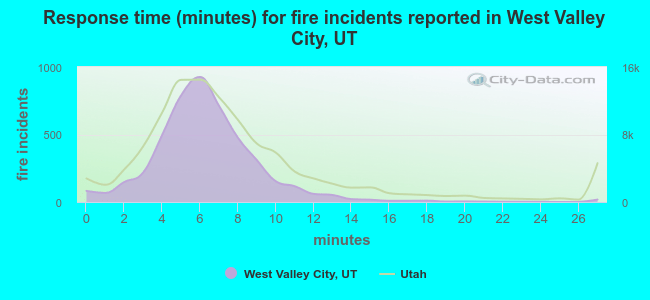 The median response time based on all reported fire incidents is 6 minutes. This is about the same as the Utah median value.
The median response time in West Valley City, UT compared to nearest cities:
(Note: Based on data for all years, including only cities with at least 500 fire incidents)
| West Valley City: | 6 minutes |
| Kearns: | 7 minutes |
| Taylorsville: | 7 minutes |
| Magna: | 8 minutes |
| South Salt Lake: | 6 minutes |
| West Jordan: | 6 minutes |
| Murray: | 6 minutes |
| Salt Lake City: | 7 minutes |
| Midvale: | 6 minutes |
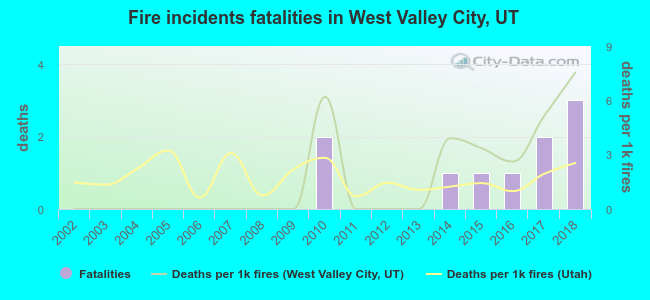 Based on the data from the years 2002 - 2018 the average number of fire-related fatalities per year is 1. The highest number of reported deaths - 3 took place in 2018, and the lowest - 0 in 2002. The data has a rising trend.
The average number of fatalities per 1,000 fires is 2. This indicator was the highest - 8 in 2018, and the lowest 0 in 2002. The trend for fatalities per 1,000 fires is growing. Compared to the Utah value the number of deaths per 1,000 incidents is higher.
Based on the data from the years 2002 - 2018 the average number of fire-related fatalities per year is 1. The highest number of reported deaths - 3 took place in 2018, and the lowest - 0 in 2002. The data has a rising trend.
The average number of fatalities per 1,000 fires is 2. This indicator was the highest - 8 in 2018, and the lowest 0 in 2002. The trend for fatalities per 1,000 fires is growing. Compared to the Utah value the number of deaths per 1,000 incidents is higher.Deaths per 1,000 incidents in West Valley City, UT compared to nearest cities:
(Note: Based on data for all years, including only cities with at least 2,500 fire incidents)
| West Valley City: | 2.1 |
| West Jordan: | 1.2 |
| Murray: | 0.8 |
| Salt Lake City: | 1.8 |
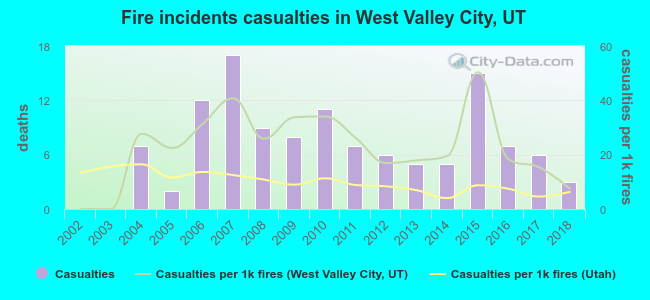 According to the reports from the years 2002 - 2018 the average number of fire-related yearly casualties is 7. The highest number of reported casualties - 17 took place in 2007, and the lowest - 0 in 2002. The data has a rising trend.
The average number of casualties per 1,000 fires is 23. This indicator was the highest - 50 in 2015, and the lowest 0 in 2002. The trend for casualties per 1,000 fire incidents is rising. Compared to the Utah value the number of injuries per 1,000 fires is much higher.
According to the reports from the years 2002 - 2018 the average number of fire-related yearly casualties is 7. The highest number of reported casualties - 17 took place in 2007, and the lowest - 0 in 2002. The data has a rising trend.
The average number of casualties per 1,000 fires is 23. This indicator was the highest - 50 in 2015, and the lowest 0 in 2002. The trend for casualties per 1,000 fire incidents is rising. Compared to the Utah value the number of injuries per 1,000 fires is much higher.Casualties per 1,000 incidents in West Valley City, UT compared to nearest cities:
(Note: Based on data for all years, including only cities with at least 500 fire incidents)
| West Valley City: | 25.5 |
| Kearns: | 13.4 |
| Taylorsville: | 8.6 |
| Magna: | 3.4 |
| South Salt Lake: | 7.7 |
| West Jordan: | 14.4 |
| Murray: | 5.4 |
| Salt Lake City: | 17.1 |
| Midvale: | 13.4 |
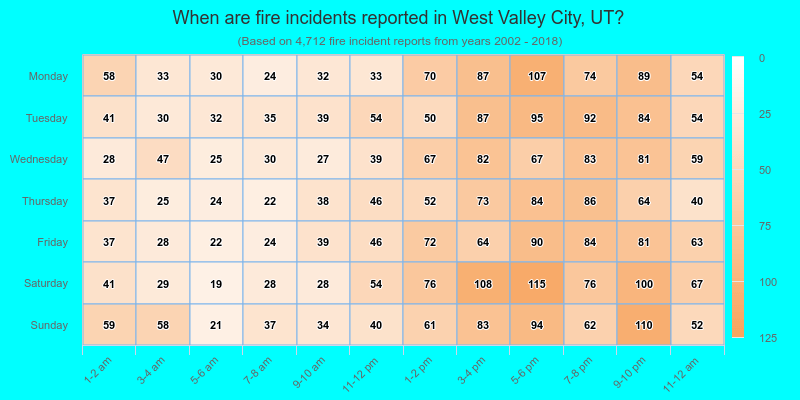
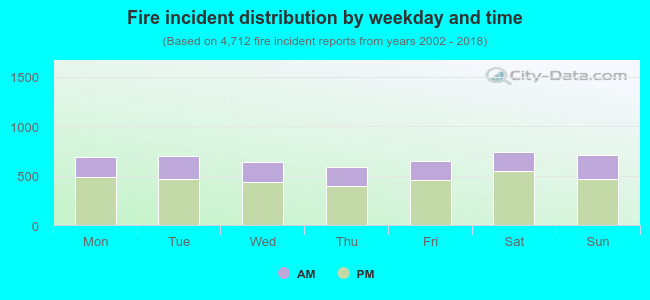 31.3% incidents where reported in the morning and 68.7% in the evening. The most fires (15.7%) took place on Saturday, and the least (12.5%) on Thursday.
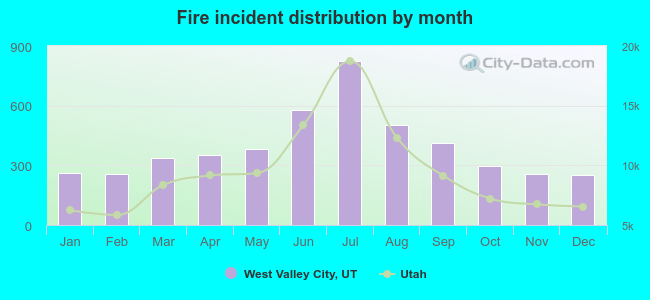 Based on the 4,712 fire incident reports from years 2002 - 2018 most fires (17.5%) took place during July, and the least (5.3%) in December.
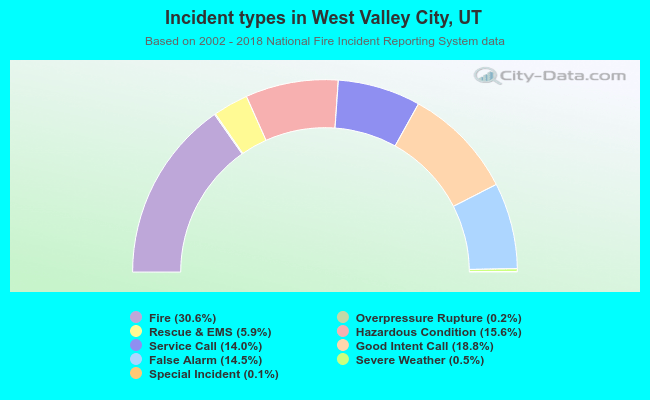 Out of all 15,421 cases reported during the years 2002 - 2018, the most belonged to the categories: Fire (30.6%), Good Intent Call (18.8%), and Hazardous Condition (15.6%).
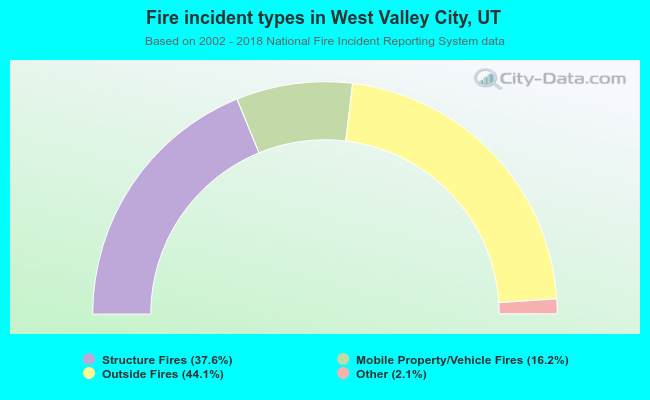 When looking into fire subcategories, the most incidents belonged to: Outside Fires (44.1%), and Structure Fires (37.6%).