Springfield: Fire Incidents, Ohio (OH)
Where are fire incidents reported in Springfield, OH
Something went wrong! Please refresh the page.
| Fire incidents reported | |
|---|---|
| Sreet name | Count |
| LIMESTONE ST | 498 |
| HIGH ST | 454 |
| MAIN ST | 406 |
| PLEASANT ST | 252 |
| NATIONAL RD | 210 |
| YELLOW SPRINGS ST | 182 |
| BURNETT RD | 180 |
| FOUNTAIN AV | 176 |
| NORTH ST | 172 |
| LAGONDA AV | 166 |
| BECHTLE AV | 162 |
| SELMA RD | 160 |
| INTERSTATE 70 | 158 |
| UPPER VALLEY PIKE | 146 |
| SOUTHERN AV | 142 |
| PLUM ST | 132 |
| LIBERTY ST | 128 |
| MULBERRY ST | 126 |
| BELMONT AV | 124 |
| TROY RD | 122 |
| GRAND AV | 118 |
| KENTON ST | 118 |
| RACE ST | 116 |
| JEFFERSON ST | 110 |
| CLIFTON AV | 108 |
| JOHN ST | 108 |
| LINDEN AV | 108 |
| SHERMAN AV | 108 |
| EUCLID AV | 106 |
| FIRST ST | 106 |
| Other | 4,196 |
2002 - 2018 National Fire Incident Reporting System (NFIRS) incidents
- Incident types reported to NFIRS in Springfield, OH
- 75,60770.3%Rescue & EMS
- 9,3988.7%Fire
- 7,2136.7%Hazardous Condition
- 6,3325.9%Service Call
- 4,7764.4%False Alarm
- 3,9433.7%Good Intent Call
- 1220.1%Severe Weather
- 1140.1%Overpressure Rupture
- Fire incident types reported to NFIRS in Springfield, OH
- 4,30245.8%Structure Fires
- 3,19134.0%Outside Fires
- 1,85119.7%Mobile Property/Vehicle Fires
- 540.6%Other
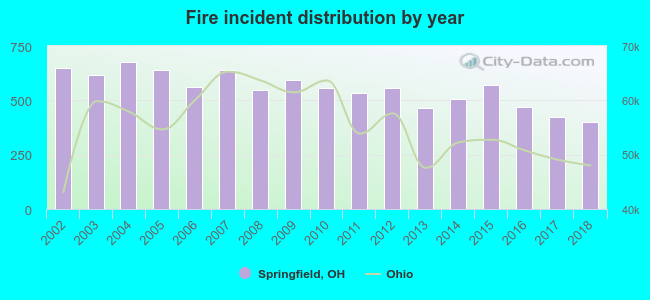 According to the data from the years 2002 - 2018 the average number of fire incidents per year is 553. The highest number of fire incidents - 678 took place in 2004, and the least - 399 in 2018. The data has a decreasing trend.
The average number of yearly fire incidents per 10k residents in Springfield, OH compared to nearest cities:
(Note: Based on data for the last 3 years, including only cities with population 5,000 and above)
| Springfield: | 71.8 |
| New Carlisle: | 93.9 |
| Urbana: | 68.3 |
| Fairborn: | 22.3 |
| Huber Heights: | 30.3 |
| Xenia: | 40.1 |
| London: | 73.6 |
| Beavercreek: | 4.4 |
| Riverside: | 20.2 |
 The median response time based on all reported fire incidents is 6 minutes. This is about the same as the state median value.
The median response time in Springfield, OH compared to nearest cities:
(Note: Based on data for all years, including only cities with at least 500 fire incidents)
| Springfield: | 6 minutes |
| South Charleston: | 14 minutes |
| New Carlisle: | 8 minutes |
| Urbana: | 8 minutes |
| Fairborn: | 6 minutes |
| Mechanicsburg: | 9 minutes |
| Huber Heights: | 6 minutes |
| Xenia: | 6 minutes |
| Jamestown: | 11 minutes |
 According to the reports from the years 2002 - 2018 the average number of fire-related yearly deaths is 1. The highest number of deaths - 3 took place in 2002, and the lowest - 0 in 2006. The data has a constant trend.
The average number of fatalities per 1,000 fires is 2. This indicator was the highest - 8 in 2018, and the lowest 0 in 2006. The trend for deaths per 1,000 fire incidents is rising. Compared to the Ohio value the number of deaths per 1,000 fires is similar.
According to the reports from the years 2002 - 2018 the average number of fire-related yearly deaths is 1. The highest number of deaths - 3 took place in 2002, and the lowest - 0 in 2006. The data has a constant trend.
The average number of fatalities per 1,000 fires is 2. This indicator was the highest - 8 in 2018, and the lowest 0 in 2006. The trend for deaths per 1,000 fire incidents is rising. Compared to the Ohio value the number of deaths per 1,000 fires is similar.
 According to the reports from the years 2002 - 2018 the average number of fire-related yearly casualties is 10. The highest number of injuries - 20 took place in 2004, and the lowest - 4 in 2006. The data has an increasing trend.
The average number of casualties per 1,000 fires is 19. This indicator was the highest - 38 in 2018, and the lowest 7 in 2015. The trend for casualties per 1,000 incidents is rising. Compared to the state value the number of injuries per 1,000 fire incidents is higher.
According to the reports from the years 2002 - 2018 the average number of fire-related yearly casualties is 10. The highest number of injuries - 20 took place in 2004, and the lowest - 4 in 2006. The data has an increasing trend.
The average number of casualties per 1,000 fires is 19. This indicator was the highest - 38 in 2018, and the lowest 7 in 2015. The trend for casualties per 1,000 incidents is rising. Compared to the state value the number of injuries per 1,000 fire incidents is higher.Casualties per 1,000 incidents in Springfield, OH compared to nearest cities:
(Note: Based on data for all years, including only cities with at least 500 fire incidents)
| Springfield: | 18.9 |
| South Charleston: | 1.8 |
| New Carlisle: | 4.3 |
| Urbana: | 21.0 |
| Fairborn: | 27.6 |
| Mechanicsburg: | 9.5 |
| Huber Heights: | 35.6 |
| Xenia: | 24.3 |
| Jamestown: | 2.7 |
 33.3% incidents where reported in the morning and 66.7% in the evening. The most fires (15.5%) took place on Sunday, and the least (13.3%) on Tuesday.
 According to the 9,398 reports from years 2002 - 2018 most fires (9.8%) took place during July, and the least (6.3%) in February.
 Out of all 107,546 cases reported during the years 2002 - 2018, the most belonged to the categories: Rescue & EMS (70.3%), Fire (8.7%), and Hazardous Condition (6.7%).
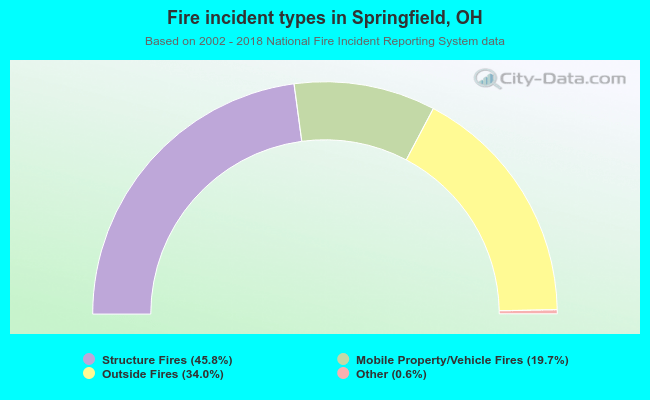 When looking into fire subcategories, the most incidents belonged to: Structure Fires (45.8%), and Outside Fires (34.0%).